Troubleshooting¶
Common issues and their solutions for Cloud-Native DCS.
Administrator sections
Sections marked (Administrator) require cluster access and are intended for system administrators. End users can skip them.
Operator Issues (Administrator)¶
CrashLoopBackOff¶
Symptoms: Operator pod restarts repeatedly.
Common causes:
- Missing CRDs: Upgrade the Helm chart to install CRDs
- Invalid kubeconfig: Check RBAC permissions for the operator service account
- Database connection failure (historian): Verify DATABASE_URL is correct
and PostgreSQL is reachable
OOMKilled¶
Symptoms: Operator pod killed with OOMKilled reason, restarts.
Common causes: - Metrics cardinality leak: Too many unique label combinations in Prometheus metrics - Large number of resources: Increase memory limits in Helm values
Fix: Ensure you are running the latest version.
Terminated Pods That Are Not a Failure¶
Symptoms: kubectl get pods -n dcs-system lists operator pods as
Completed or Error alongside a healthy Running one, often several
revisions old.
These are almost always node-shutdown casualties. Read the
DisruptionTarget condition, which is the one field that says so. The phase
does not: a shutdown kills every pod on the node at the same instant, and each
one lands in Succeeded or Failed according to whichever exit code its
process happened to return when SIGTERM arrived.
# Every terminated pod, with the reason it terminated.
kubectl get pods -n dcs-system -o json | jq -r '
  .items[]
  | select(.status.phase=="Failed" or .status.phase=="Succeeded")
  | [ .metadata.name,
      .status.phase,
      ((.status.conditions // [])
        | map(select(.type=="DisruptionTarget"))
        | .[0].reason // "no-disruption-condition")
    ] | @tsv'
TerminationByKubelet with the message "Pod was terminated in response to
imminent node shutdown" means the pod died with its node. Nothing is wrong with
the operator and there is nothing to fix. Confirm the timing against the node if
you want the whole story:
kubectl get pod -n dcs-system <pod> -o jsonpath='{.status.conditions}' | jq
kubectl get nodes -o wide          # compare against the node's last restart
A terminated pod with no DisruptionTarget condition is the one worth
investigating. So is any pod that is still Running while restarting, which is
what a real crash loop looks like. That case is
CrashLoopBackOff above.
Leftovers accumulate because the pod garbage collector only reaps at
--terminated-pod-gc-threshold, which defaults to 12500. The chart ships a
reaper for its own namespace and the cluster-wide setting is documented in
production-deployment.md § "Reap terminated pods".
The Pod Reaper Never Runs¶
Symptoms: the Pod Reaper card on the System Health page reads
degraded with "No successful run in ...", or dcs health says the same.
Terminated pods keep accumulating with podReaper.enabled: true, and
kubectl get cronjob -n dcs-system shows a last-schedule time that is hours or
days old.
The reaper deletes pods through the apiserver, so it does not care which node it lands on. It does have to land on one. Start with the pod. The CronJob will tell you less:
kubectl get jobs -n dcs-system -l app.kubernetes.io/component=pod-reaper
kubectl get pods -n dcs-system -l app.kubernetes.io/component=pod-reaper
kubectl describe pod -n dcs-system <the Pending one>
A FailedScheduling event naming untolerated taints is the whole diagnosis. It
happens on a cluster where every node carries a taint, which is the ordinary
shape of a hardened deployment: the control-plane nodes are tainted
node-role.kubernetes.io/control-plane:NoSchedule, and the device nodes carry
dcs.io/role=device-node:NoSchedule, which the chart puts there itself. The
chart tolerates the control-plane taint by default. If your platform nodes carry
a taint of your own, declare it in podReaper.tolerations, and it is merged with
the control-plane entry.
One unplaceable run used to be worse than one missed hour. A Job whose pod
never schedules does not fail, it stays active, and charts before 0.7.6 set
concurrencyPolicy: Forbid. Every later run was then suppressed, and the reaper
stayed parked until somebody deleted the Job by hand. A Helm upgrade could not
free it, because the Job is the CronJob's child and an upgrade rewrites only the
CronJob. On the reference bench one such Job survived five upgrades and nine
days.
The CronJob runs under concurrencyPolicy: Replace since 0.7.6. A run that is
still active at the next scheduled minute is deleted and replaced, so upgrading
to this chart frees a parked reaper at the next :23 with nothing to run by
hand. Until then, or on an older chart, delete the Job:
kubectl delete job -n dcs-system <the stuck job>
podReaper.activeDeadlineSeconds ends a run that cannot place after ten
minutes, so on a current chart a placement fault shows as a failed Job rather
than as a Pending pod. The health card reads the CronJob's last success rather
than its newest Job, so a parked run reads degraded whichever way it ended.
The audit archiver and the historian prune CronJobs carry the same two settings
since 0.7.6, with a deadline sized just under each one's own schedule
(historian.audit.archival.activeDeadlineSeconds,
historian.prune.activeDeadlineSeconds). The same diagnosis applies to either.
Start with the pod, and expect a FailedScheduling event on a cluster whose
platform nodes carry a taint the historian's tolerations do not name. The
Historian Prune card is on the System Health page from this release, so a
parked prune is visible the same way.
Reconciliation Errors¶
Symptoms: Resources stuck in unexpected state, reconcile error logs.
Check the Diagnostics page in the gateway UI for reconcile error rates:
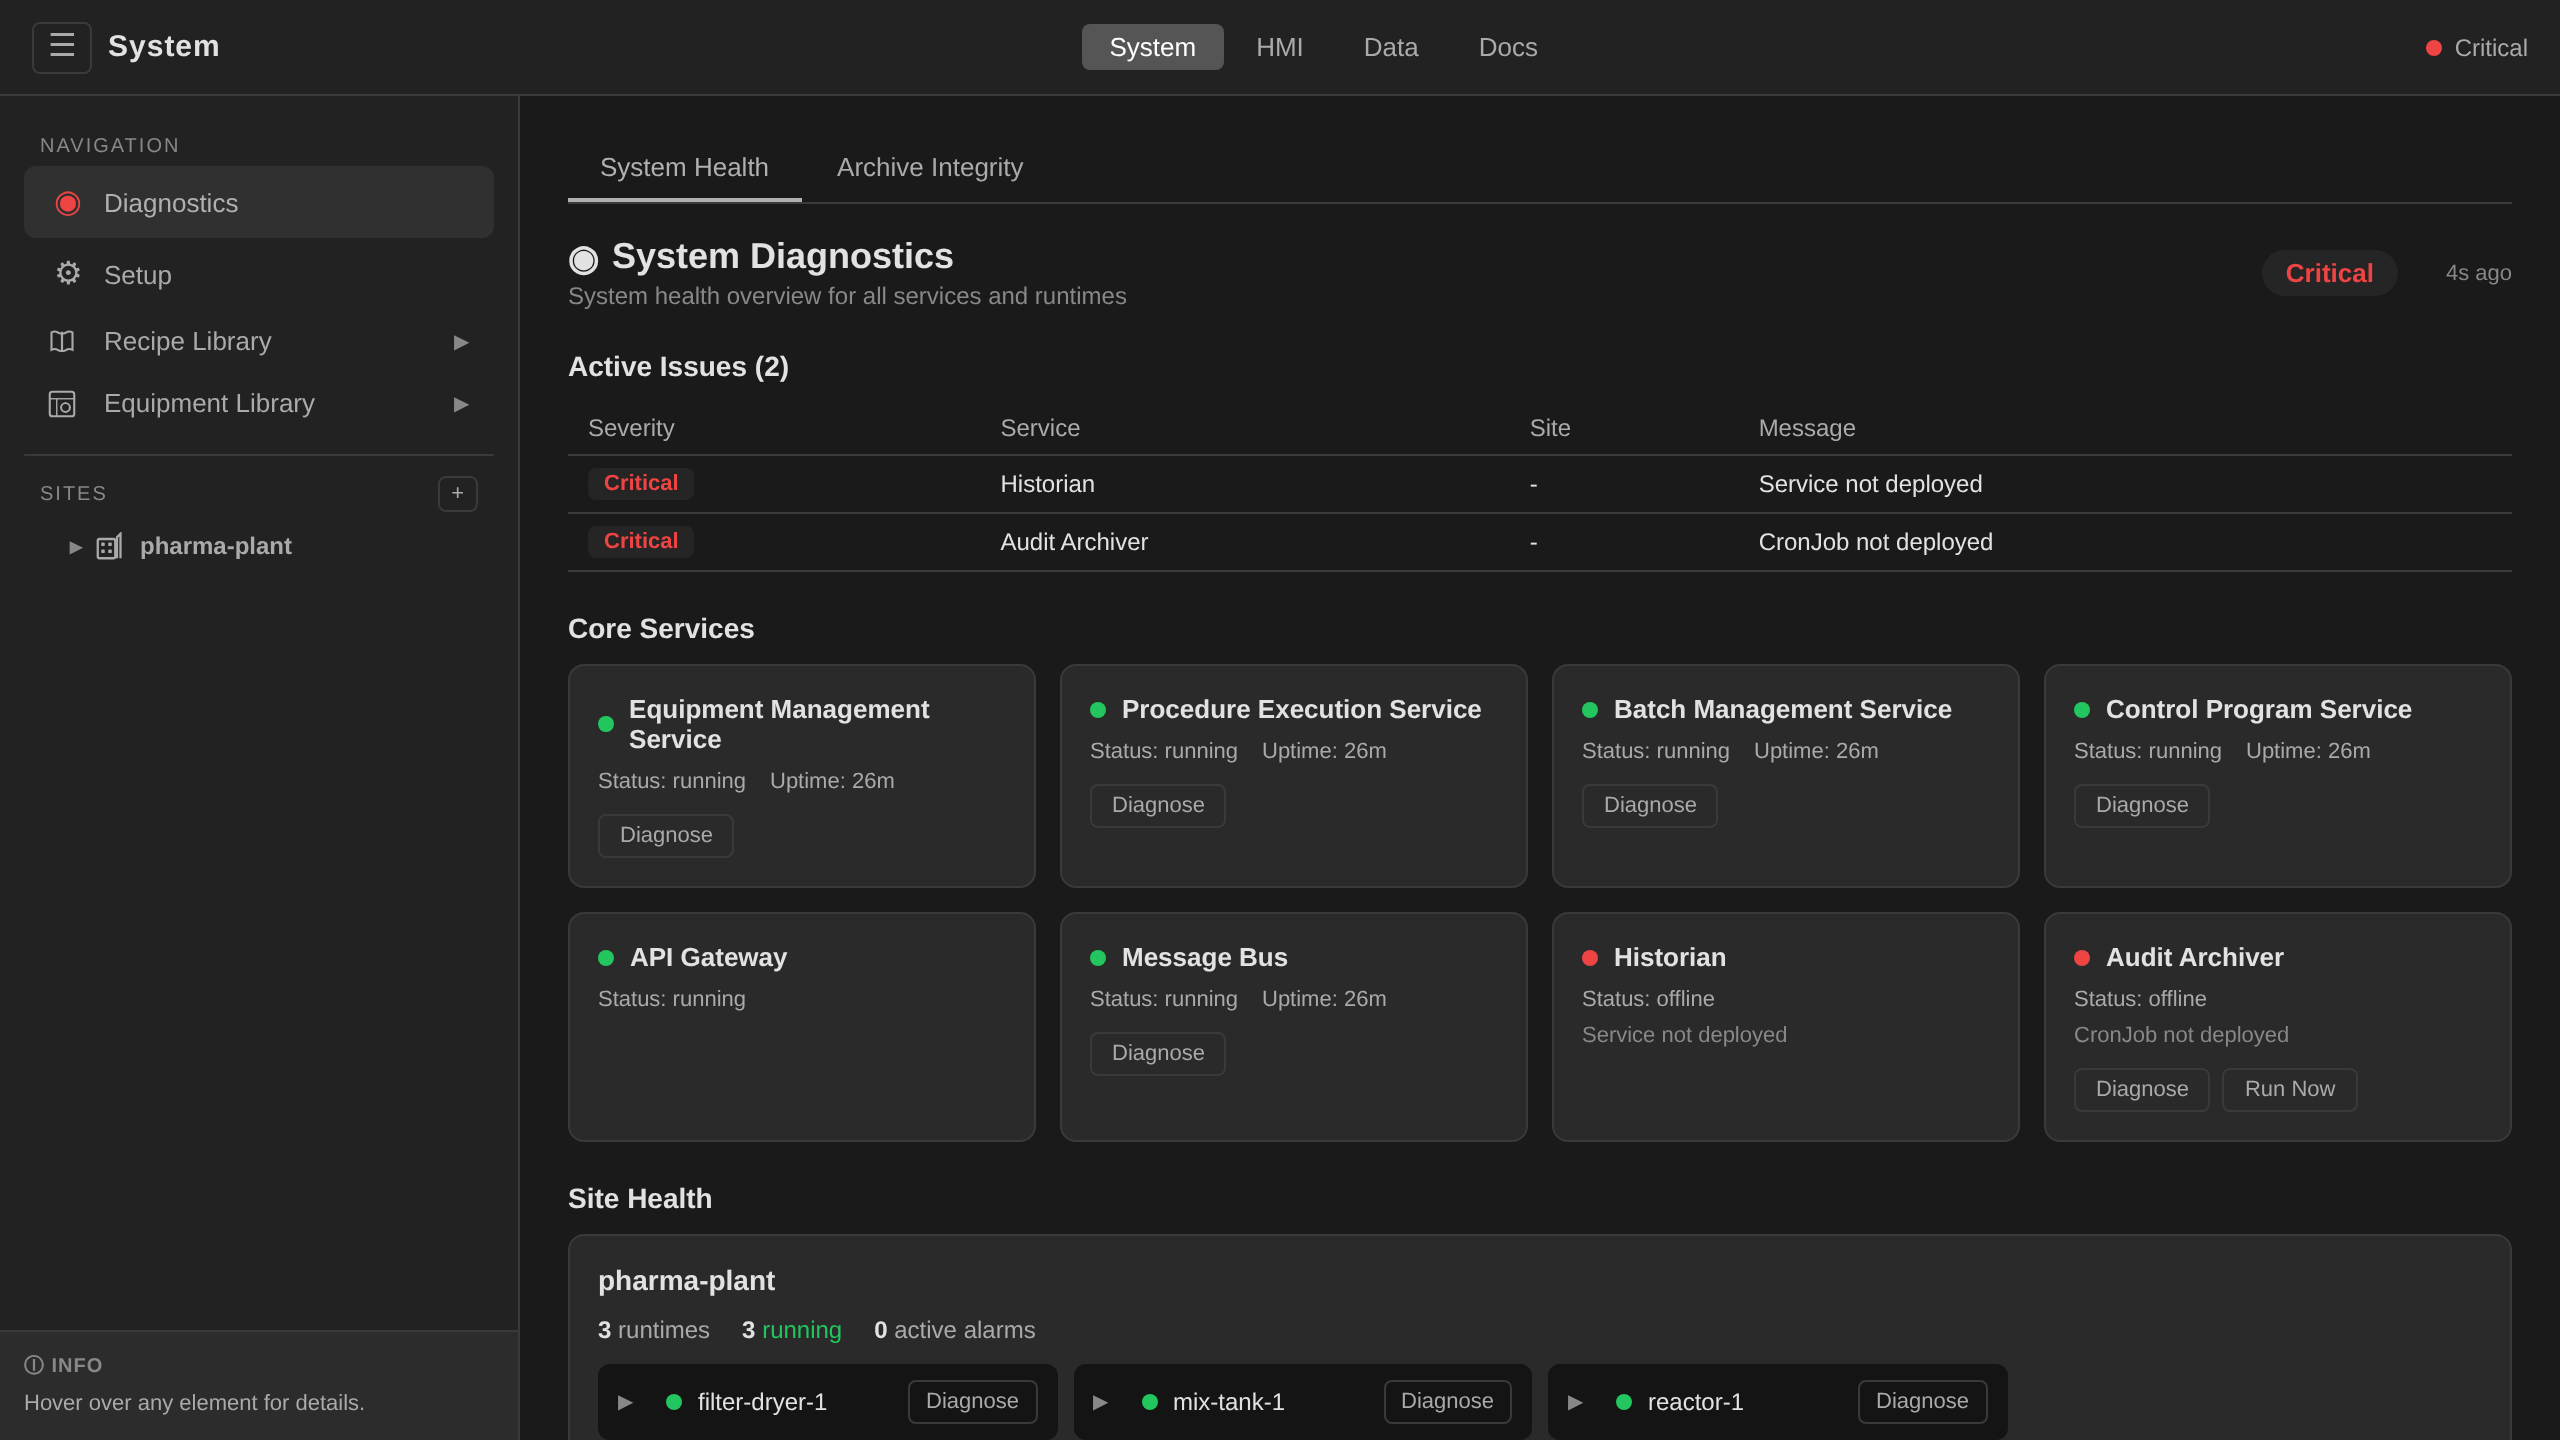
Diagnosing a degraded service from the UI¶
When a Core Service card shows a degraded or offline state, click
Diagnose on the card. The card expands into a triage panel with three
tabs. The rest of the page stays visible and keeps polling behind it, so the
other services are still readable while you work. Escape or Close
collapses the panel.
Optional components (Historian, Historian Prune, Audit Archiver, Pod Reaper) that were never installed
show a neutral not-installed state instead. That is a supported
minimal-install configuration: it raises no active issue and does not
affect the overall health verdict. A previously installed component whose
workload still exists but has no pods reports offline as before.
Diagnose stays available on such a card, because explaining why nothing is
there is what it is for. Run Now does not. A CronJob-backed component that
is not installed has no CronJob for a run to start from, so the button is
disabled and says CronJob is not deployed on hover. A CronJob that is
installed but suspended is disabled the same way and says so.
A Run Now that is absent is a third condition. It says nothing about the
component. It is about the session. Triggering a run is the
system:service-run action, at the engineer tier, and a session whose
resolved action set does not carry it is offered no Run Now on any card.
Diagnose is unaffected, because it reads. Run dcs auth entitlements to see
the actions the session holds.
The card's own line names the condition wherever the component can name it.
A service whose process is running but not ready is asked for its readiness
verdict, and that answer becomes the card's line. The Historian card reads
database unavailable through a database outage. Before #1957 it showed the
generic Service not ready for the whole outage. The uptime beside it is
the pod's, and it is shown while the service is degraded as well as while it
is healthy.
The Historian's line says what the outage is costing as well as what it is (#2116). The gateway reads the historian's ingest account beside its readiness verdict. Through an outage the card reads the first line below while the records are waiting, and the second once the buffer has started giving them up:
database unavailable; buffering: 12,400 tag records held for 3m of 1h 0m
database unavailable; dropping records: 45,371 tag records dropped since 19:32Z
A historian that is dropping records is degraded whatever its readiness
probe says. For a day after the outage the card runs with data lost: 45,371
tag records lost between 19:32Z and 20:09Z under it, and the episode is on
record in the historian's ingest_gaps table after that. A healthy card
carries no line at all. The historian always holds records between two
flushes, and a flush in progress holds its batch until the database
answers. The count the card renders is what has been held past two flush
cycles (#2127). Records younger than that are waiting for the flush, and
the database has not fallen behind on them. See
Historian for the two bounds
the buffer is held inside.
The Failure detail tab summarises what the platform knows about the component's current state. A service that has crashed carries its pod failure reason, last exit code and restart count. A service that is still running but reporting itself unhealthy carries its status and the summary it reported. The historian below is the second case, degraded because its database is unreachable while the process itself is up. CronJob-backed components also carry the timestamp of the last successful run.
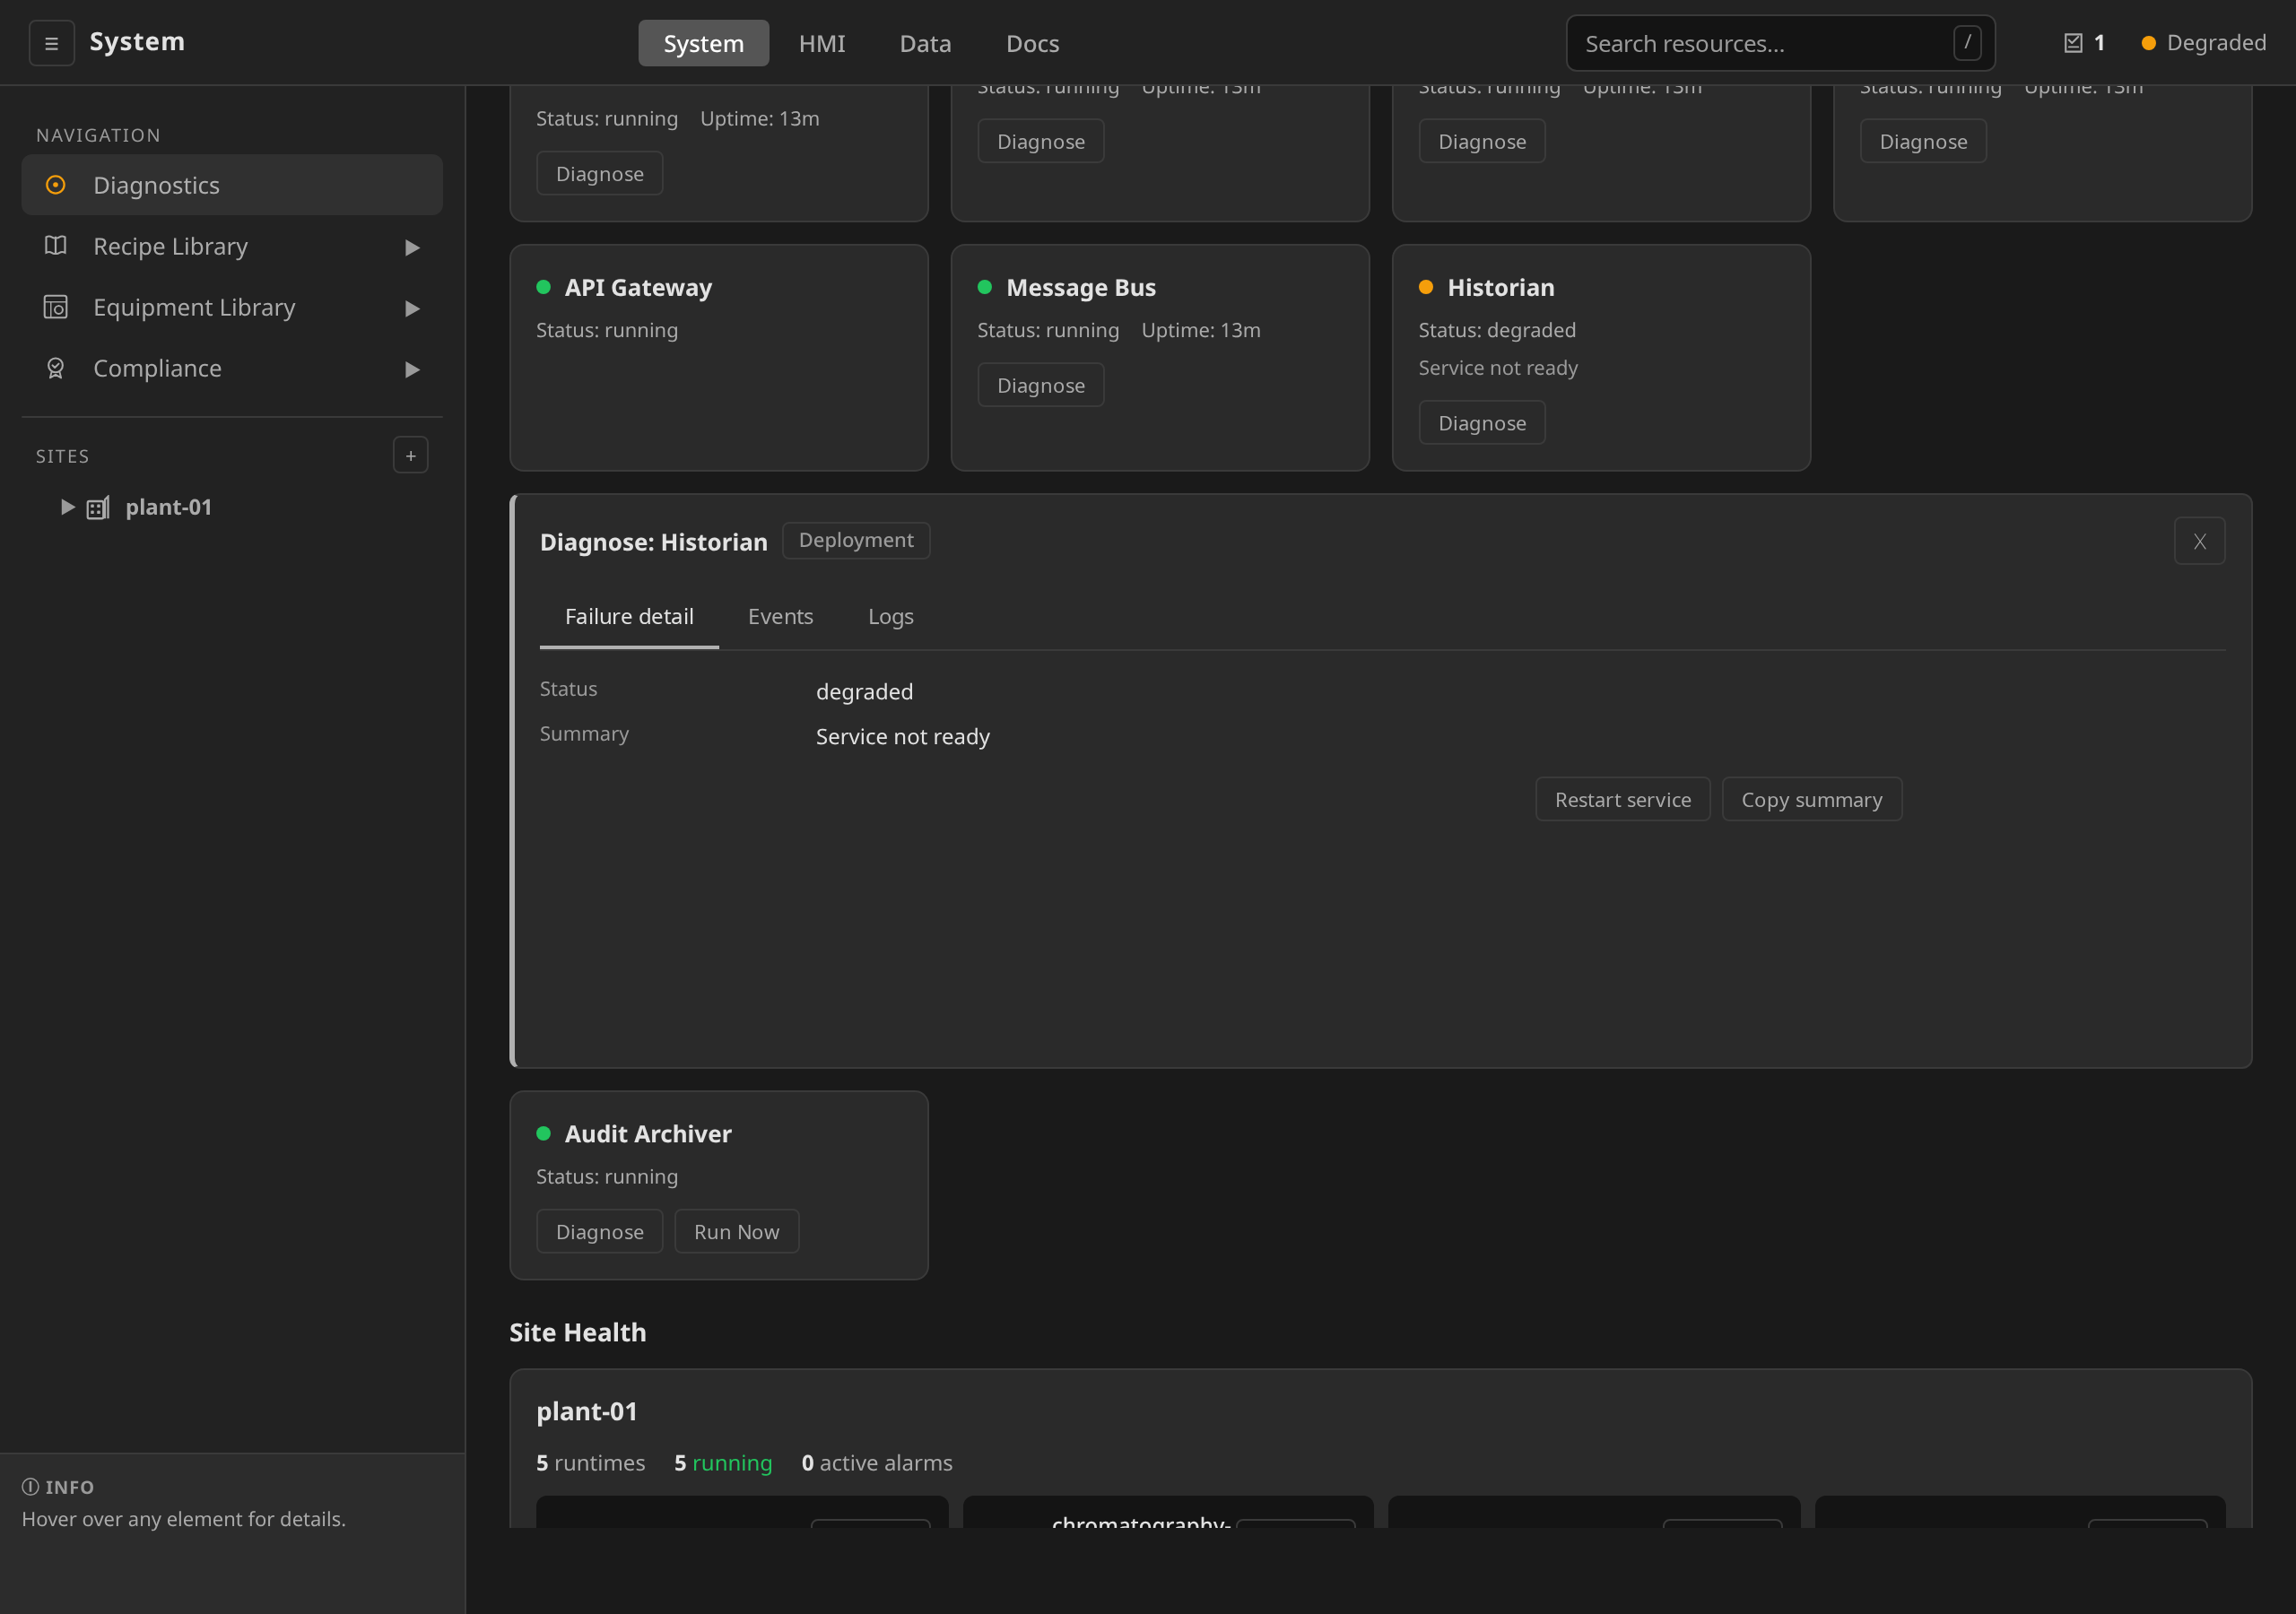
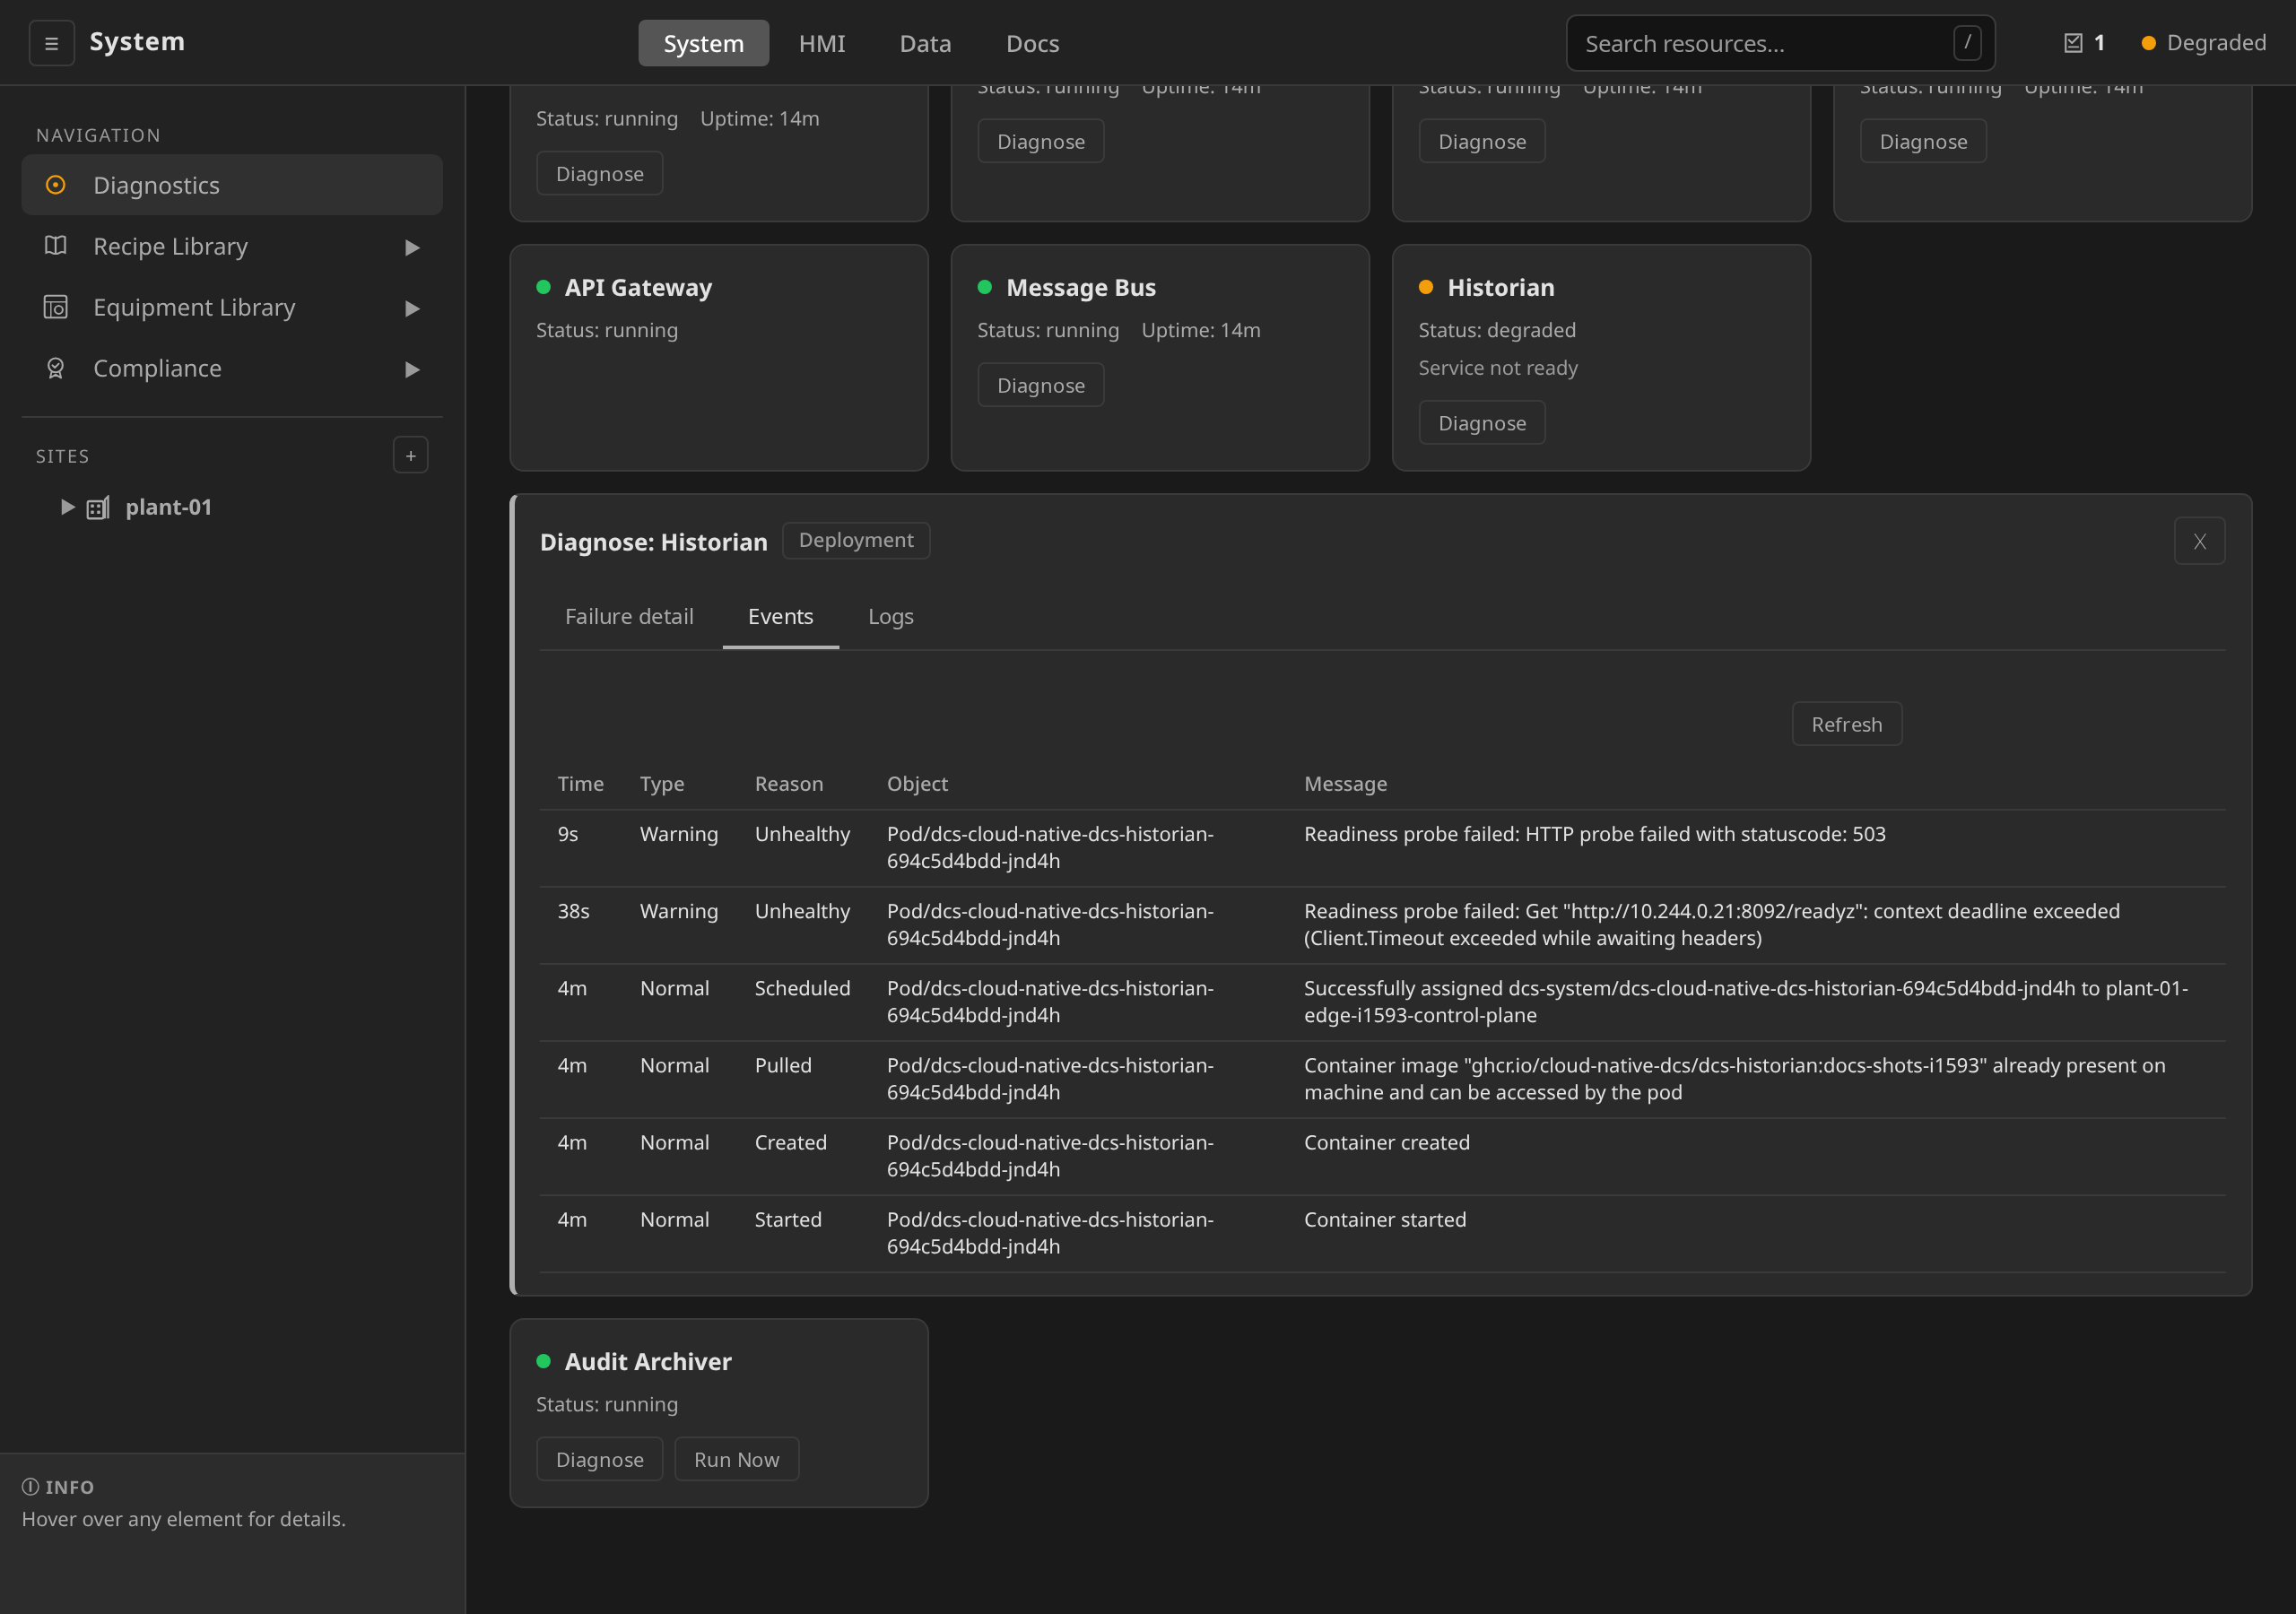
The Events tab surfaces recent Kubernetes events for the component's
pods, jobs, and CronJob: readiness probe failures, image pull errors,
scheduler decisions. It is the same data that dcs health --events <component>
returns, useful when the failure summary alone does not tell you why.
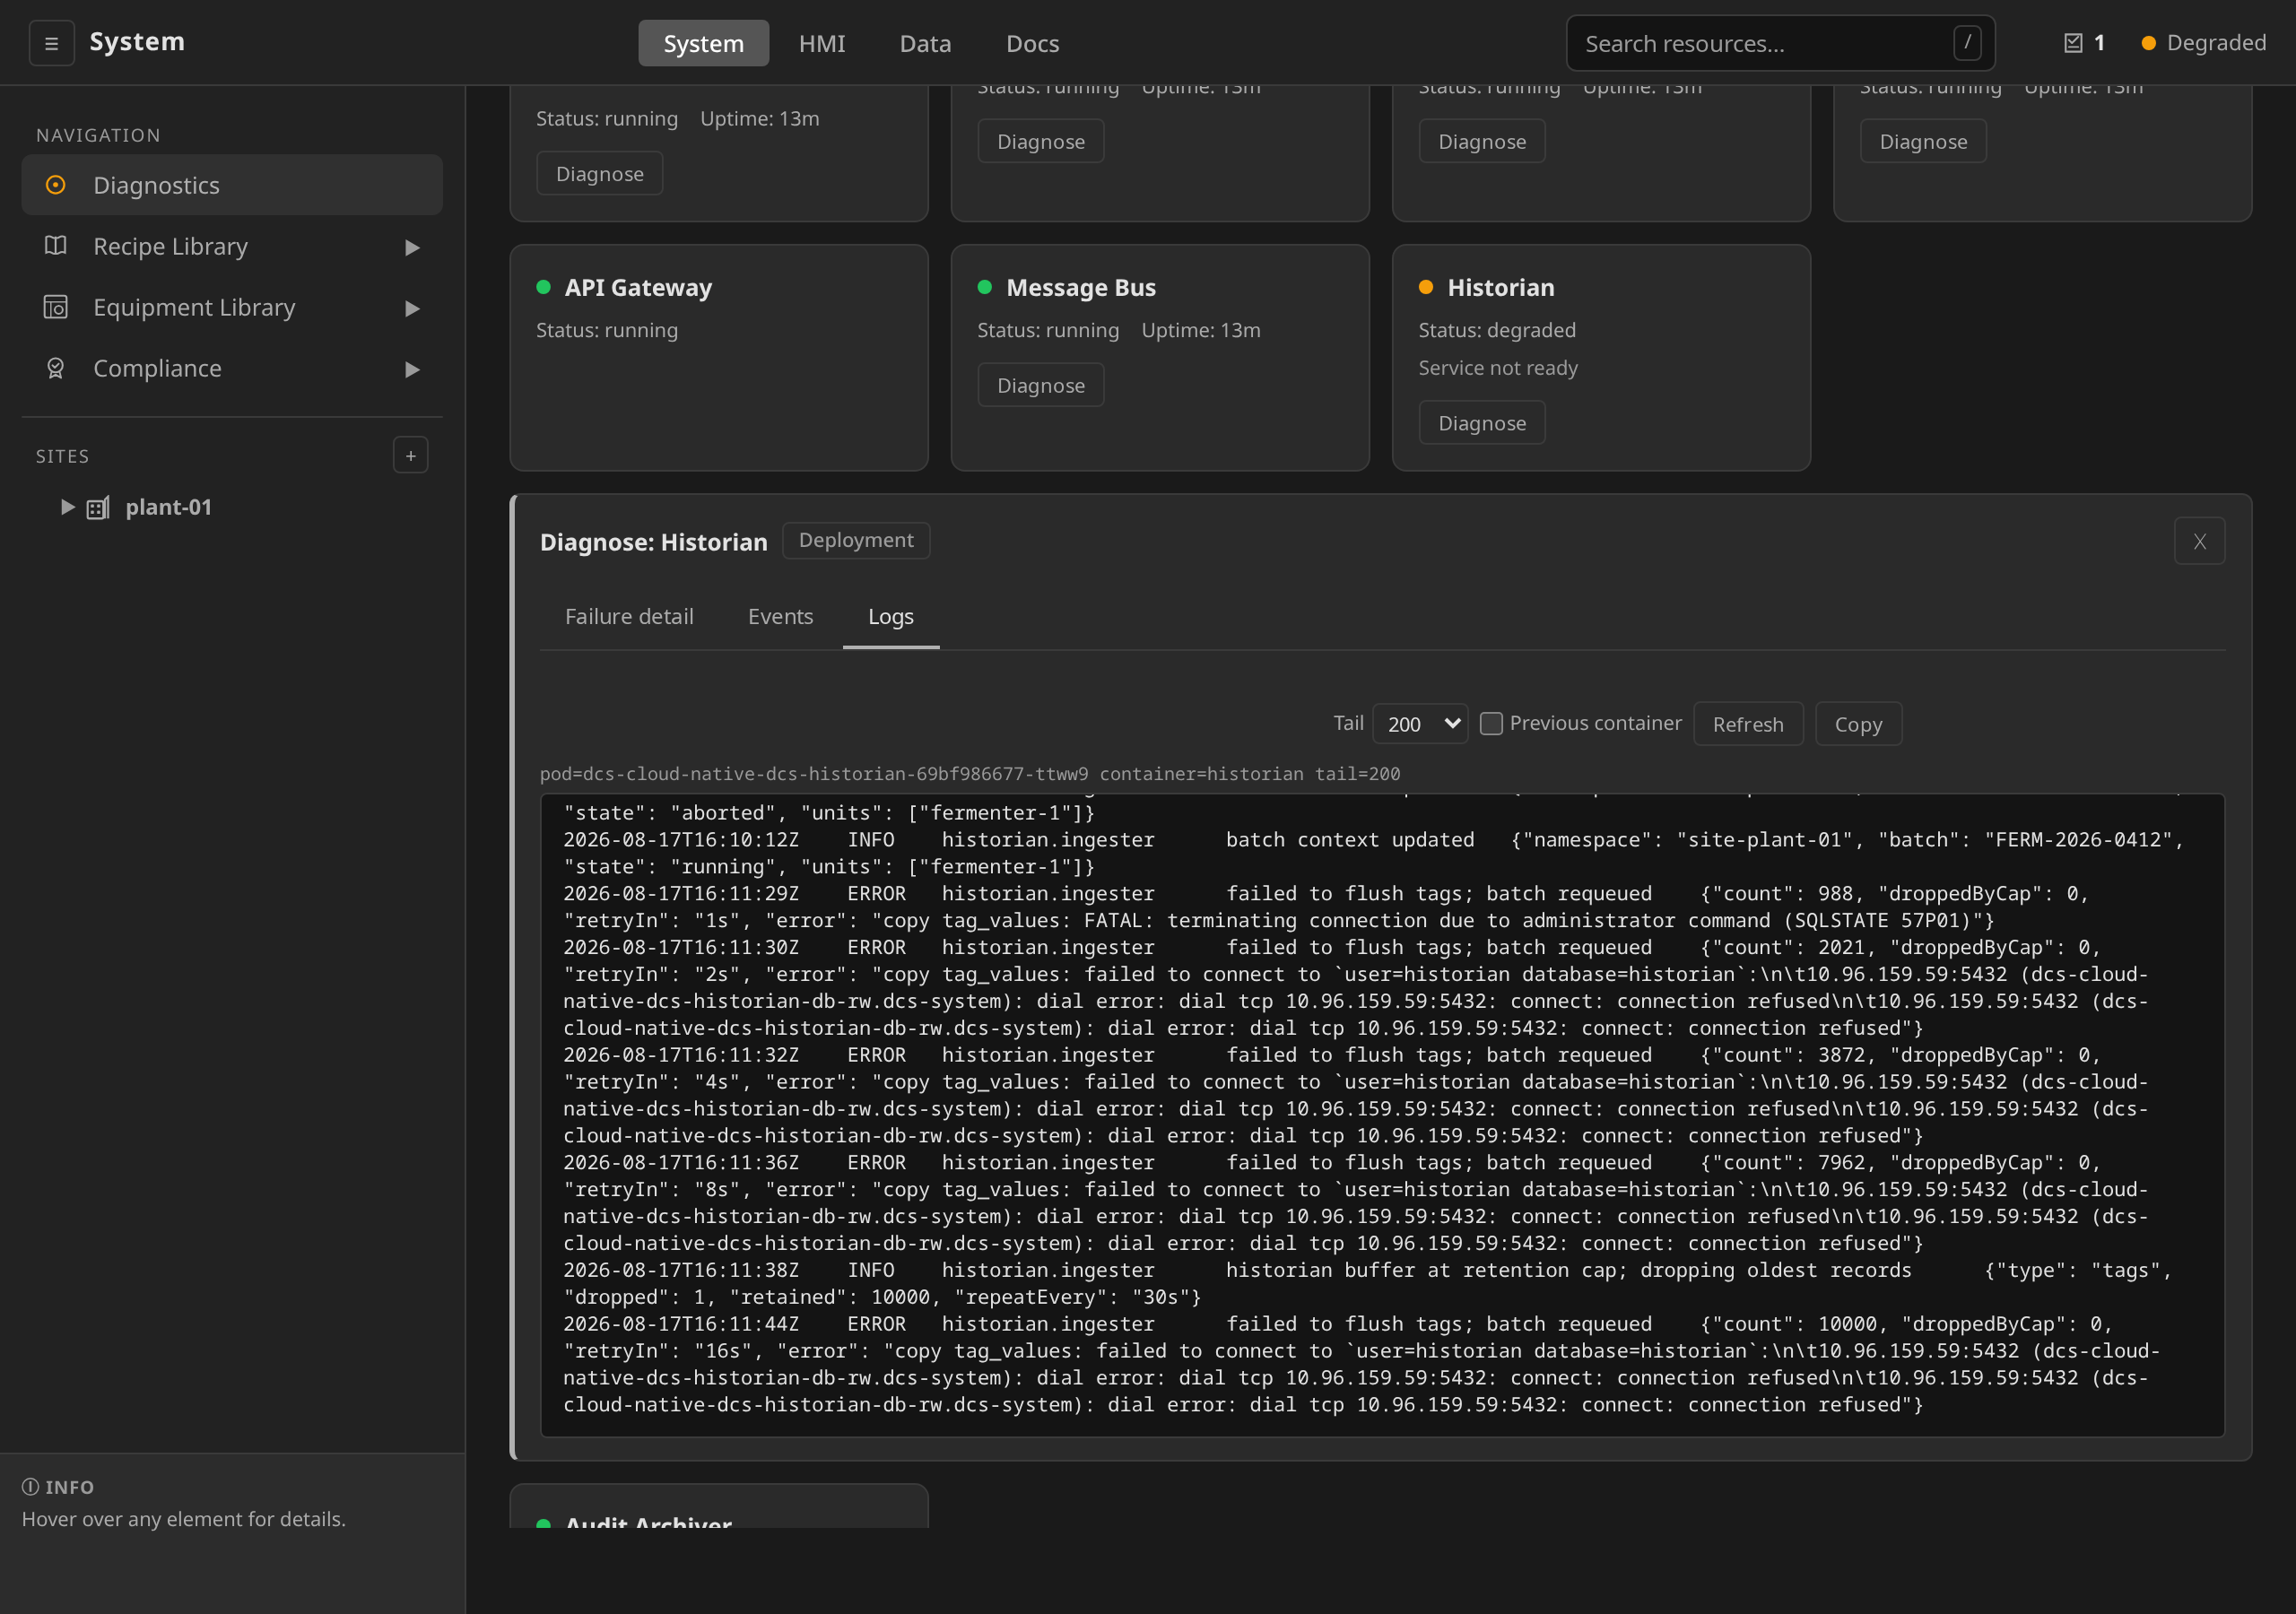
The Logs tab tails the most relevant pod's stdout. For a chronically-
restarting Deployment, toggle Previous container to read the prior
crash. Output is capped at 1 MiB and 2000 lines. For the full log stream
fall back to dcs health --logs <component> --tail 2000 or kubectl logs.
Every component logs in the same format at the same verbosity, which is the
console encoder at info (ADR 0063). When a fault needs more detail than the
default carries, raise the whole release with logging.level: debug. The
product's V(1) lines are per-request and per-scan detail, so expect the
2000-line window to cover a much shorter span while it is on.
logging.encoder and logging.stacktraceLevel sit beside it. See
Security Operations § Log format for
what each accepts and when a collector wants JSON.
For Deployment-backed services (everything except the audit-archiver
CronJob) the Restart service button on the Failure tab triggers a
rollout that honours maxSurge / maxUnavailable. Restarting the gateway
itself is blocked at the API. Use kubectl rollout restart for that case.
A restart is only the fix when the fault lives in the pod. When the
evidence points below the service (the Historian's Events tab showing
readiness probe failures and its Logs tab full of
failed to flush tags … database=historian errors), the component is a
casualty of the real cause, and restarting it would change nothing. Fix the
dependency instead and let the card recover on its own.
The Historian card says both halves of that itself. Through a database outage it reads:
database unavailable; buffering: 12,651 tag records held for 14s of 1h 0m
The Failure detail tab's Summary row carries the same line whole. The first
clause is the cause. The second is what the
outage is costing: the historian holds every record its database has not
taken, for up to the retention named at the end, and the count is what has
waited past two flush cycles, so a healthy card carries no such clause at
all. If the outage outlasts the buffer the line turns to dropping
records: with the count and the bound that took them, and once the
database is back a green card says what was lost for a day afterwards.
The walkthrough below triages exactly that case: a Historian degraded by a
database outage, diagnosed through the three tabs, then recovered with
kubectl against the database while the Restart button stays untouched.
kubectl recovery of the database, with Restart service in frame the whole time and truthfully never the fix.Runtime Issues¶
Runtime Pod Not Starting¶
Symptoms: Unit shows RuntimeReady: false, no runtime pod exists.
Common causes:
- Missing node with matching nodeSelector label
- Node not ready
- Image pull failure
Diagnosis:
dcs get units -s lab
Check the Unit detail in the gateway UI for RuntimeReady condition status.
Runtime Cannot Connect to I/O Module¶
Symptoms: Runtime pod runs but I/O reads return errors.
Common causes: - Network unreachable: Check that the runtime pod can reach the I/O module IP - Wrong protocol/port: Verify IOModule CR has correct protocol and address - Firewall: Ensure EtherNet/IP (TCP 44818) or Modbus (TCP 502) is allowed
Diagnosis:
Check the Diagnostics page in the gateway UI for runtime connectivity status. The I/O module health is also shown on the Equipment page.
Runtime OPC UA Connection Failure¶
Symptoms: OPC UA driver fails to connect.
Common causes: - Incorrect endpoint URL in IOModule CR - Security policy mismatch (the client supports None, Basic256Sha256) - Certificate not trusted by the OPC UA server
Diagnosis:
Check the Diagnostics page for OPC UA connection errors. The IOModule status in the gateway UI shows connectivity health.
State Machine Issues¶
Resource Stuck in Transitional State¶
Symptoms: A Unit, Phase, or Batch is stuck in Starting, Stopping,
Holding, Restarting, or Aborting.
Explanation: Transitional states (ending in "-ing") require a
StateComplete signal to advance. The controller that owns the resource
must emit this signal when the physical action completes.
Diagnosis:
dcs get phases -s lab
Fix: Check the controller logs for the owning operator. If the phase controller is waiting for a runtime response, verify the runtime is running and reachable.
Command Annotation Not Processing¶
Symptoms: Setting dcs.io/command=Start has no effect.
Common causes:
- Resource is not in a valid state for the command (e.g., Start is only
valid from Idle)
- The owning operator is not running
- RBAC: The operator lacks permission to update the resource
Diagnosis:
dcs get unit reactor-1 -s lab
See the Architecture section for the valid state/command matrix.
Batch Issues¶
Batch Stuck in Allocating¶
Symptoms: Batch stays in Allocating phase.
Common causes:
- No available Units matching the recipe's unit requirements
- Units are already allocated to other batches
- Units are not in Idle state
Diagnosis:
dcs get batch <name> -s lab
dcs get units -s lab
Batch Failed¶
Symptoms: Batch transitions to Failed state.
Diagnosis:
dcs get batch <name> -s lab
dcs get phases -s lab
Check the Batch detail page in the gateway UI for events and the procedural tree for the failing phase.
MQTT Issues (Administrator)¶
MQTT Connection Failure¶
Symptoms: Components log MQTT connection errors.
Common causes: - Broker unreachable: Check broker status in the Diagnostics page - Authentication failure: Verify MQTT credentials in Helm values - TLS mismatch: Verify CA/cert/key configuration
Historian Not Receiving Data¶
Symptoms: Historian REST API returns empty results.
Common causes:
- MQTT topics mismatch: Verify runtimes are publishing to expected topics
- Database connection issue
- Buffer not flushing: Check dcs_historian_buffer_size metric in Monitoring
Historian Database Volume Filling, No Recent Backup in the Store¶
Symptoms: the CNPG data volume grows steadily with no matching growth in
the tables, pg_wal holds far more segments than the retention settings
suggest, and the object store has no base backup since the day backups were
turned on. The database itself keeps serving reads and writes until the volume
is full, at which point the node goes into disk pressure and evicts whatever
else is scheduled on it.
Cause: WAL archiving is failing. PostgreSQL does not drop a segment it has
not archived, so a store it cannot reach converts into disk usage. No watched
error fires. On a cluster whose CNI enforces
NetworkPolicy, the usual reason is that the database pods' own policy carries
no rule for the store. Their policyTypes is [Ingress, Egress], so they
reach exactly what the policy names. Wrong credentials, a wrong bucket and a
firewall in the way all present the same way.
Fix: name the destination in the chart. See
historian.backup.s3.egress
for both forms: CIDRs for a store outside the cluster, pod labels for one
served inside it. The port is taken from historian.backup.s3.endpointURL, so
a store on :9000 is allowed on 9000. Before #1516 the rule hard-coded 443. On a chart rendered with
networkPolicies.enabled this value is required, so a deployment that reaches
this state from a policy denial is one whose values predate that requirement.
Confirm the repair against the store, by listing the bucket for a base backup newer than the change. The chart rendering is not evidence the packets arrive.
Audit Archival Issues (Administrator)¶
Audit Archiver Run Failed on a Fresh Cluster¶
Symptoms: the Audit Archiver card reads degraded shortly after a first
install, its Logs tab ends in failed to connect to database … connection
refused, and the overall system-health verdict stays degraded until the next
scheduled run.
Cause: nothing orders the archival CronJob after the historian database. On a fresh bring-up the first scheduled run can fire while the CNPG cluster is still initialising, so the archiver has nothing to connect to through no fault of its own. Which installs hit this is decided by where the wall clock falls relative to the database's boot, because the schedule is a fixed cron expression.
Fix: each run now waits historian.audit.archival.databaseWait (15 minutes
by default) for the database to accept connections before it fails. Raise it if
your storage class makes a first boot slower than that, keeping three times the
value inside historian.audit.archival.activeDeadlineSeconds. The wait is spent
per pod, so a database that is down for good is waited on once per
backoffLimit attempt. The deadline bounds the whole Job. On the shipped
defaults the fourth attempt is cut short by it, which changes nothing about the
verdict.
# values.yaml
historian:
  audit:
    archival:
      databaseWait: 30m
A cluster already carrying a failed run does not have to wait for the next scheduled one. Trigger a run by hand once the database is ready, and the verdict returns to healthy as soon as it completes:
dcs health --run audit-archiver
A run that still fails with the database up is a real failure. Read its Logs
tab for the reason. A missing dcs-signing-key Secret and a misconfigured S3
mirror both fail the run deliberately. Archiving unsigned or unmirrored
records is what the failure prevents.
Audit Archiver Reports the Mirror Endpoint Unreachable¶
Symptoms: the Audit Archiver card reads degraded on a deployment with
the Object Lock mirror enabled, and every run's Logs tab ends in
audit mirror endpoint is unreachable — refusing to archive. The historian
and the rest of the archive chain look fine, because they are.
Cause: the pod cannot open a connection to the S3 endpoint. On a cluster
whose CNI enforces NetworkPolicy, the usual reason is that the archiver's own
policy carries no rule for the endpoint. Its policyTypes is [Egress], so
it reaches exactly what the policy names. Firewall rules and endpoint outages
produce the same message, and so does an endpoint spelled wrong.
Fix: name the destination in the chart. See
historian.audit.archival.immutable.egress
for both forms: CIDRs for a host outside the cluster, pod labels for a
bucket served inside it. On a chart rendered with networkPolicies.enabled
this value is required, so a deployment that reaches this message from a
policy denial is one whose values predate that requirement.
The check runs at startup and fails the run, which is deliberate: the run
would otherwise report a clean no-op on every hour that has nothing past the
retention cutoff, and a fresh deployment has 90 days of those. A refusal from
the endpoint is not a failure here. The documented bucket policy grants the
archiver s3:PutObject alone, so a 403 counts as the endpoint answering.
Diagnostics Gateway Page¶
The gateway web UI's System app includes a Diagnostics page (◉ icon) that shows: - Operator health status - Runtime connectivity - Recent alarm summary - Reconciliation error rates
Access it at https://<gateway-host>/system#diagnostics.
The Top-Bar Health Chip Reads Unreachable¶
The chip in the top bar of every screen polls the gateway every 15 seconds. It reads Unreachable when a poll gets no answer inside its own deadline of 8 seconds. The deadline is what makes the chip honest about a machine that has gone dark. A gateway that stops cleanly never needed it, because it refuses the connection and the poll fails within the tick. A host that loses power behind a live switch refuses nothing. The request sits in the established connection while the browser's kernel retransmits it, which takes about fifteen minutes to give up. Without the deadline the chip read Healthy over a dark plant for all of that time. With it the chip flips within two ticks of the gateway going silent, whichever way it went.
A chip that reads Unreachable while the gateway answers other requests points at the health endpoint itself. Check the gateway pod's log for the request and its latency.
Related Documentation¶
- Architecture -- System overview and state machine
- Monitoring and Metrics -- Prometheus metrics for diagnosing issues
- Alarm Management -- Auto-generated alarms for equipment faults
- MQTT Telemetry -- MQTT broker and topic configuration