Historian¶
The historian is a time-series data collector that ingests process data, alarms, and state transitions from the control system via MQTT, stores them in PostgreSQL with TimescaleDB, and exposes a REST query API.
Architecture¶
flowchart TD
    Controllers[DCS Controllers / Runtimes] -->|MQTT publish| Broker[MQTT Broker]
    Broker -->|subscribe wildcard topics| Ingester
    subgraph Historian
        Ingester -->|in-memory buffer| Storage[PG Storage]
        Storage --> API[API Server]
    end
    Storage --> PG[(PostgreSQL + TimescaleDB)]
API -->|REST :8092| Clients[Clients]Configuration¶
The historian accepts configuration via flags and environment variables:
| Flag | Env Var | Default | Description |
|---|---|---|---|
--database-url |
DATABASE_URL |
(one of the two) | PostgreSQL connection string |
--database-url-file |
DATABASE_URL_FILE |
(one of the two) | File holding the connection string, re-read before every new connection so a rotated Secret is followed without a restart (#2116). Exclusive with --database-url |
--http-port |
-- | 8092 | REST API listen port |
--metrics-port |
METRICS_PORT |
8094 | Plaintext Prometheus /metrics port, in-cluster only; 0 disables |
--mqtt-broker |
MQTT_BROKER_URL |
(required) | MQTT broker URL |
--mqtt-username |
MQTT_USERNAME |
-- | MQTT authentication username |
--mqtt-password |
MQTT_PASSWORD |
-- | MQTT authentication password |
--mqtt-ca |
MQTT_CA_FILE |
-- | TLS CA certificate path |
--mqtt-cert |
MQTT_CERT_FILE |
-- | TLS client certificate path |
--mqtt-key |
MQTT_KEY_FILE |
-- | TLS client key path |
--buffer-size |
BUFFER_SIZE |
1000 | Flush buffer threshold (records) |
--flush-interval |
FLUSH_INTERVAL |
1s | Periodic flush frequency |
--buffer-retention |
BUFFER_RETENTION |
1h | How long a record waits for a database that is not taking it before it is dropped; negative disables the age bound (#2116) |
--buffer-max-records |
BUFFER_MAX_RECORDS |
100000 | Most records held per type while the database is not taking them, the memory bound behind the retention (#2116, #2126) |
--retention-days |
-- | 365 | Data retention period |
MQTT Topics¶
The ingester subscribes to four wildcard topics:
| Pattern | Data Type | Description |
|---|---|---|
dcs/+/runtime/+/value/# |
Tag values | Real-time process values from unit runtimes |
dcs/+/equipment/+/+/alarm |
Alarms | Alarm state transitions (physical-operator) |
dcs/+/equipment/+/+/state |
States | Equipment/procedural state transitions (physical, procedural operators) |
dcs/+/batch/+/state |
Batch context | Batch lifecycle events (batch-operator) |
Batch Context Tracking¶
The ingester monitors batch lifecycle messages and holds the binding per
unit. Every lifecycle message carries the batch's allocated units, and every
subsequent record from one of those units is tagged with that batch ID. When
the batch reaches a terminal state (complete, aborted, stopped,
failed), only that batch's units are released.
Per unit and not per namespace, because a namespace is a site and a site runs many units at once. A single slot for the whole site tagged every unit's data with whichever batch started last, and cleared it for the batch still running the moment any other batch finished (#1549).
The lifecycle topic is retained, so a historian that starts mid-batch learns
the binding on connect. Without retention it had to wait for the next
transition. A rollout, an OOM kill, a node drain, or simply deploying the
historian after a batch started leaves the tracker empty, and a fermentation
runs twelve hours between running and complete. Every record in that gap
was stored with no batch at all. Nothing reported it, because an empty tracker
looks exactly like a site with no batch running.
What the broker replays on connect is one message per batch, and the message it
replays is whichever transition happened last. That is not necessarily
running. A batch held overnight leaves held standing, so every non-terminal
state binds from the units it carries. A batch that has finished leaves a
terminal message, which releases nothing it never held and is silently inert.
Deleting the Batch resource clears the retained message outright.
Some records are addressed below the unit, such as a control module's health or an alarm on a control module. Their topic names no unit, so their publisher names one in the payload. A record whose unit cannot be determined is stored with no batch ID at all. A guess would be worse. The full chain is in MQTT Telemetry.
Database Schema¶
The historian writes four TimescaleDB hypertables, documented below. A fifth,
audit_records, is a hypertable in the same database, but the
audit-archiver writes it, alongside its audit_archive_manifest
companion (see Backup and Recovery).
tag_values¶
Stores real-time process values (analog/digital I/O readings).
| Column | Type | Description |
|---|---|---|
ts |
TIMESTAMPTZ | Observation time — see What a row's timestamp means |
namespace |
TEXT | Kubernetes namespace |
unit |
TEXT | Unit name |
address |
TEXT | I/O address |
value_num |
FLOAT8 | Numeric value (if applicable) |
value_text |
TEXT | Text value (if applicable) |
quality |
TEXT | Data quality ("Good", "Bad") |
batch_id |
TEXT | Active batch ID (if running) |
alarm_events¶
Stores alarm state transitions.
| Column | Type | Description |
|---|---|---|
ts |
TIMESTAMPTZ | Observation time — see What a row's timestamp means |
namespace |
TEXT | Kubernetes namespace |
source_kind |
TEXT | Equipment type (Unit, IOModule, etc.) |
source_name |
TEXT | Equipment name |
alarm_name |
TEXT | Alarm identifier |
severity |
TEXT | Critical, High, Medium, Low |
state |
TEXT | ISA-18.2 alarm state |
message |
TEXT | Alarm description |
batch_id |
TEXT | Active batch ID |
acknowledged_by |
TEXT | Operator who acknowledged; set only on the two acknowledged states, NULL otherwise |
state_transitions¶
Stores ISA-88 state machine transitions.
| Column | Type | Description |
|---|---|---|
ts |
TIMESTAMPTZ | Observation time — see What a row's timestamp means |
namespace |
TEXT | Kubernetes namespace |
kind |
TEXT | Resource kind (Unit, Phase, etc.) |
name |
TEXT | Resource name |
from_state |
TEXT | Previous ISA-88 state |
to_state |
TEXT | New ISA-88 state |
batch_id |
TEXT | Active batch ID |
cm_health_events¶
Stores Control Module FB-network health transitions: the timeline behind the
per-CM health the HMI shows, fed by the retained
dcs/{ns}/equipment/controlmodule/{cm}/health topic.
| Column | Type | Description |
|---|---|---|
ts |
TIMESTAMPTZ | Observation time — see What a row's timestamp means |
namespace |
TEXT | Kubernetes namespace |
cm |
TEXT | Control Module name |
state |
TEXT | Running, Down, CompileError or Unknown |
reason |
TEXT | Free-text cause; empty on a healthy transition |
network_name |
TEXT | FB network the Control Module was running |
spec_hash |
TEXT | Hash of the compiled network, so a health change can be attributed to a specific revision |
batch_id |
TEXT | Active batch ID |
ingest_gaps¶
One row per loss episode (#2116): type, started_at, ended_at,
dropped, dropped_by_age and dropped_by_ceiling, keyed on the type and
the start. It is a plain table with no retention policy. A loss record is
the one row retention must never drop.
Storage Features¶
- Hypertables: TimescaleDB auto-partitions on the
tscolumn - Compression: Chunks older than 7 days are compressed automatically
- Retention: Configurable via
--retention-days(default: 365 days) - Indexes: Composite indexes on (namespace, unit/kind, address/name, ts DESC) plus batch-specific indexes
Querying Historical Data¶
All three record types can be queried from the /data browser UI,
the dcs historian CLI, or the historian's REST API. The UI proxies
CLI and API calls through the gateway, so the data is identical
whichever path you use.
Tag Values¶
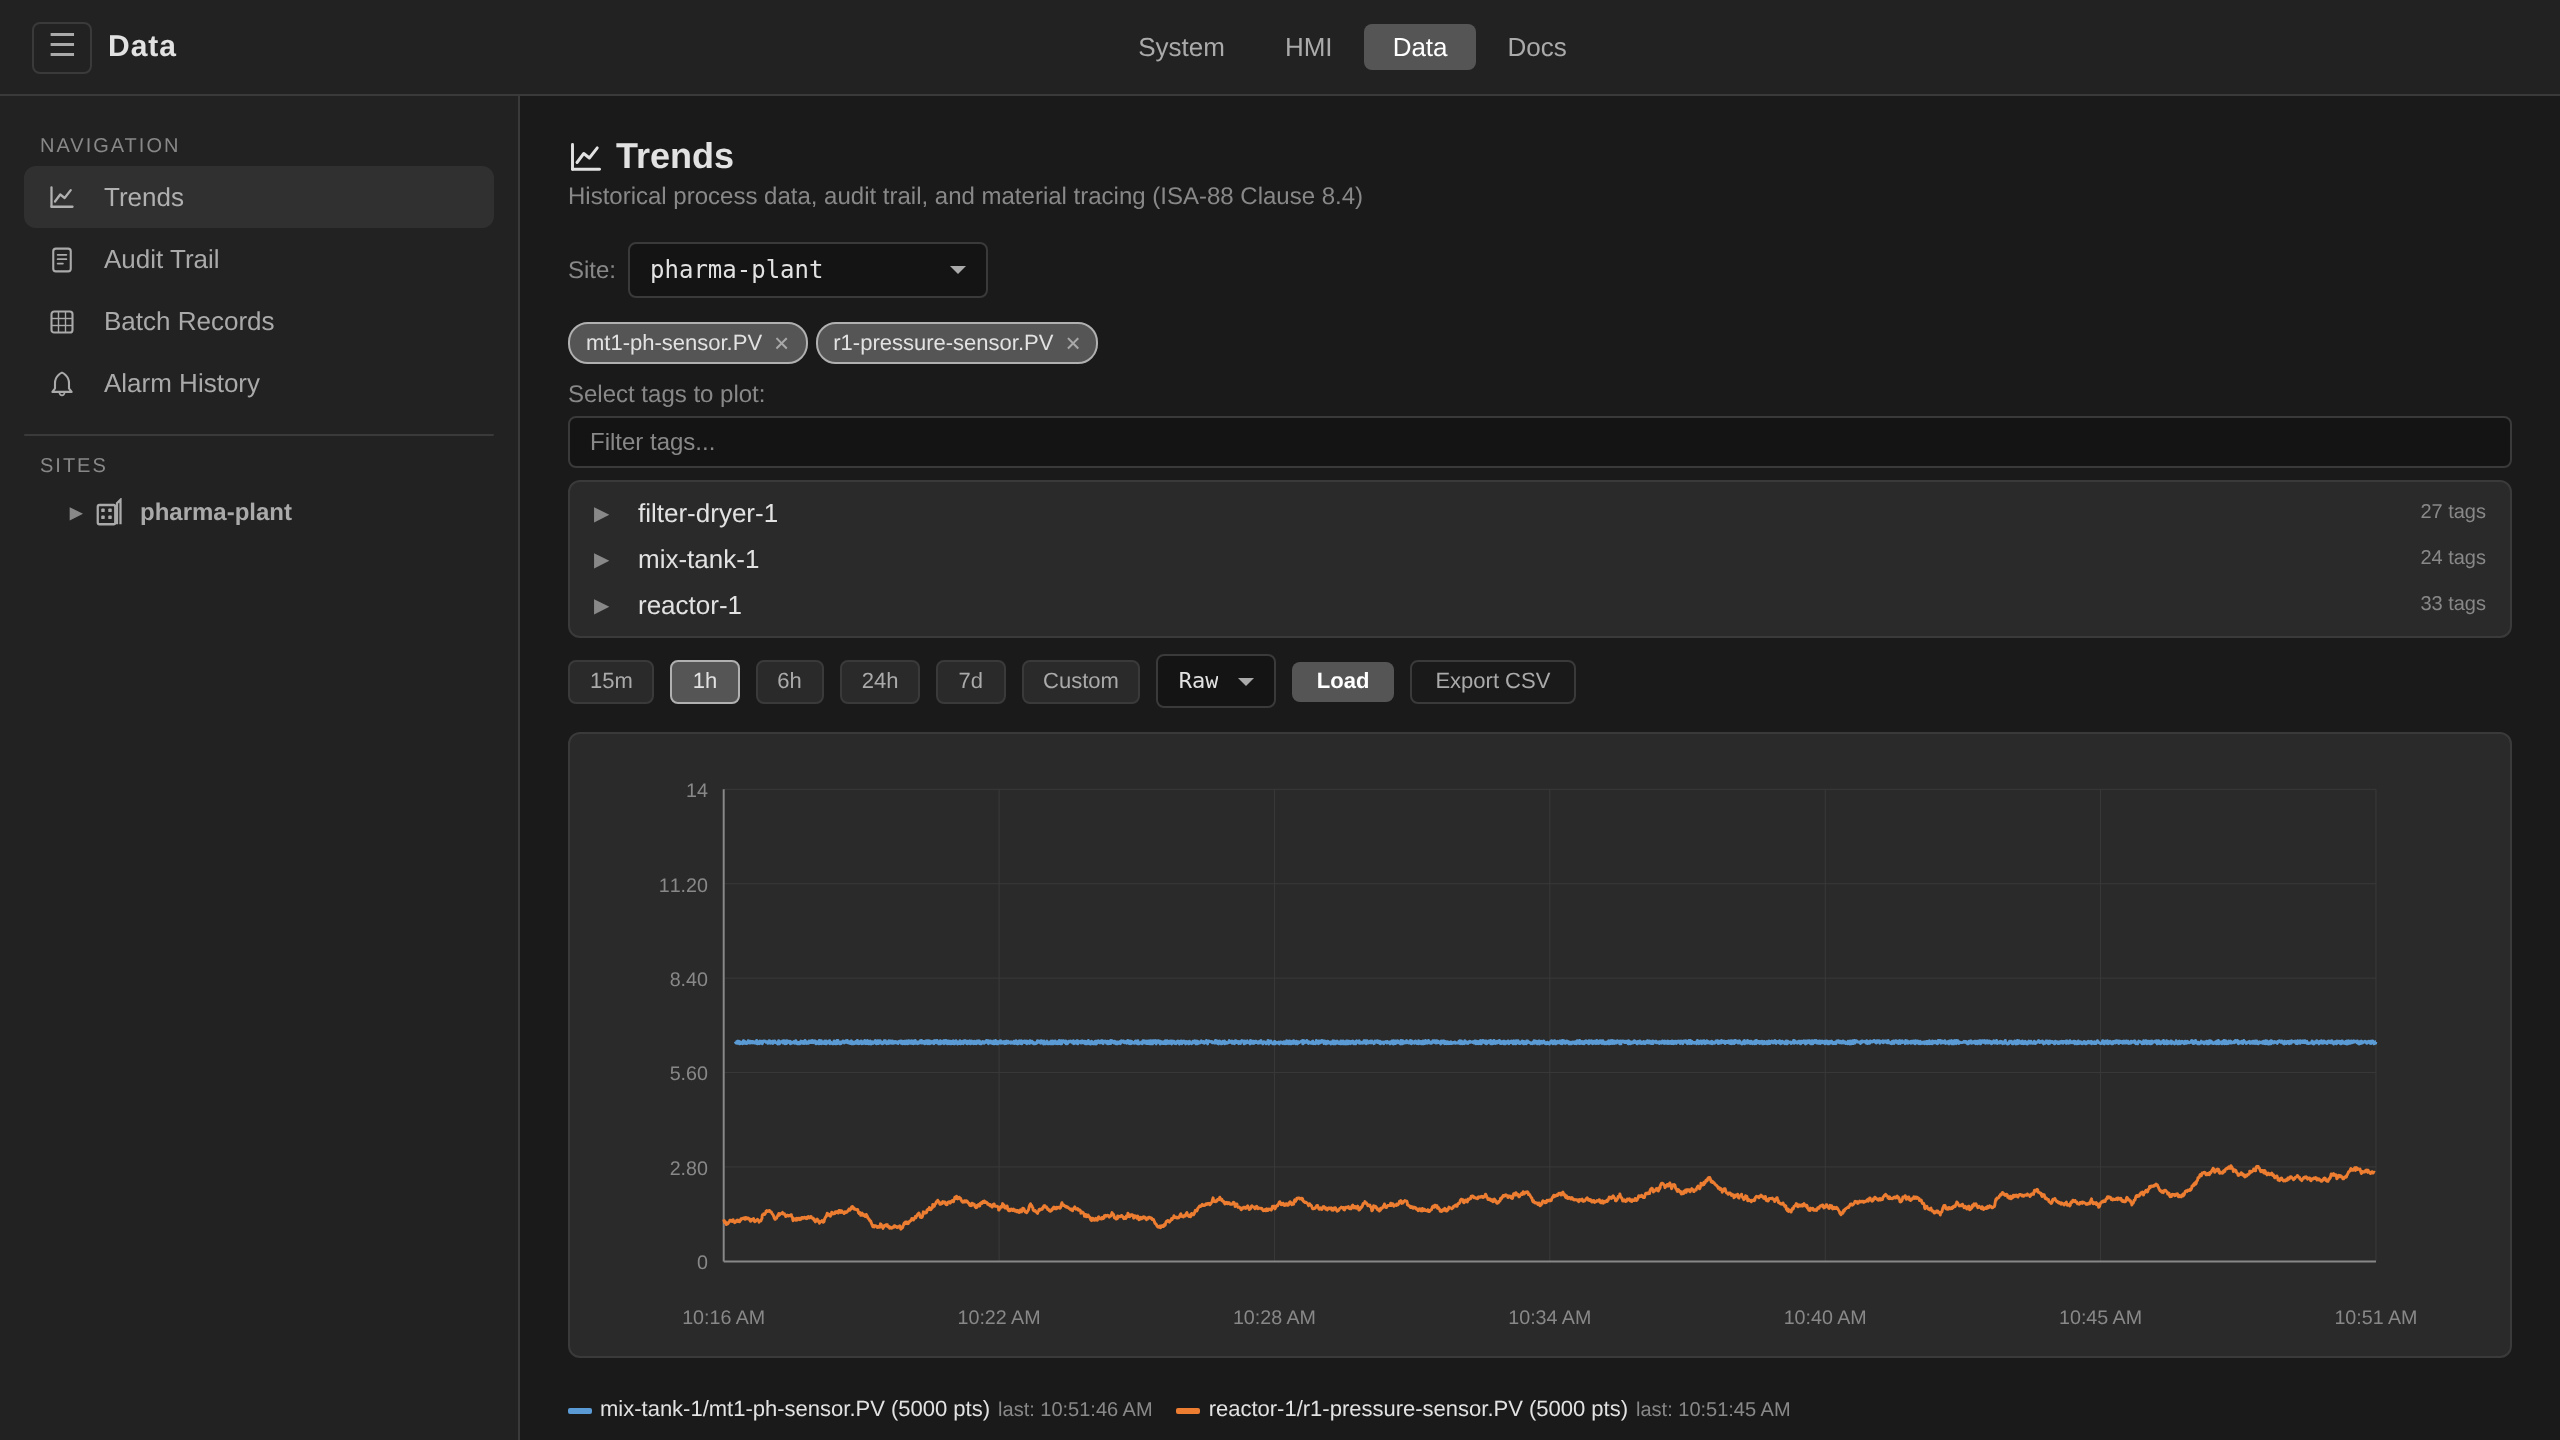
/data → Trends. Pick tags from the left tag browser
(grouped by unit and control module), set the time range (15 min /
1 h / 6 h / 24 h / 7 d preset or custom absolute window), and the
chart redraws. The Y axis uses each tag's configured engineering
range and never auto-scales from the visible window. The same tag
therefore looks the same across different time ranges. Export to CSV from the
chart toolbar.
Nothing caps how many tags you can plot at once. Each series gets its own pen, and the legend swatch below the plot is the key to which line is which. The first twenty-four pens are twenty-four colours drawn as solid lines. Past that the colours come round again with a different stroke. Pens 25 to 48 are dotted and pens 49 to 72 are dashed, and the legend swatch carries the stroke as well as the colour. Only a selection wider than seventy-two series makes two lines share a pen. The legend says when that happens.
The HMI links here too: a faceplate's Trend button opens this
view with that module's tags preselected and plotted
(#/prodinfo/trends/{site}/{unit}/{address}), defaulting to
30-second bucketed averages so the whole window keeps its shape.
The hop runs below, from the faceplate to the plotted chart to the
CSV export:
dcs historian tags \
  --unit reactor-1 \
  --from 2026-02-01T00:00:00Z \
  --to   2026-02-25T23:59:59Z \
  --agg avg --interval 5m \
  -s newark-plant
GET /api/v1/historian/tags?namespace=site-newark-plant&unit=reactor-1&start=2026-02-01T00:00:00Z&end=2026-02-25T23:59:59Z
Query parameters:
| Parameter | Required | Description |
|---|---|---|
namespace |
Yes | Kubernetes namespace |
unit |
No | Filter by unit name |
address |
No | Filter by I/O address |
batch |
No | Filter by batch ID |
start |
No | Start time (RFC3339) |
end |
No | End time (RFC3339) |
agg |
No | Aggregation: avg, min, max, last, first |
interval |
No | Bucket interval: 5s, 10s, 30s, 1m, 5m, 15m, 1h, 1d |
limit |
No | Max results (default: 1000, max: 10000) |
offset |
No | Pagination offset |
Alarm Events¶
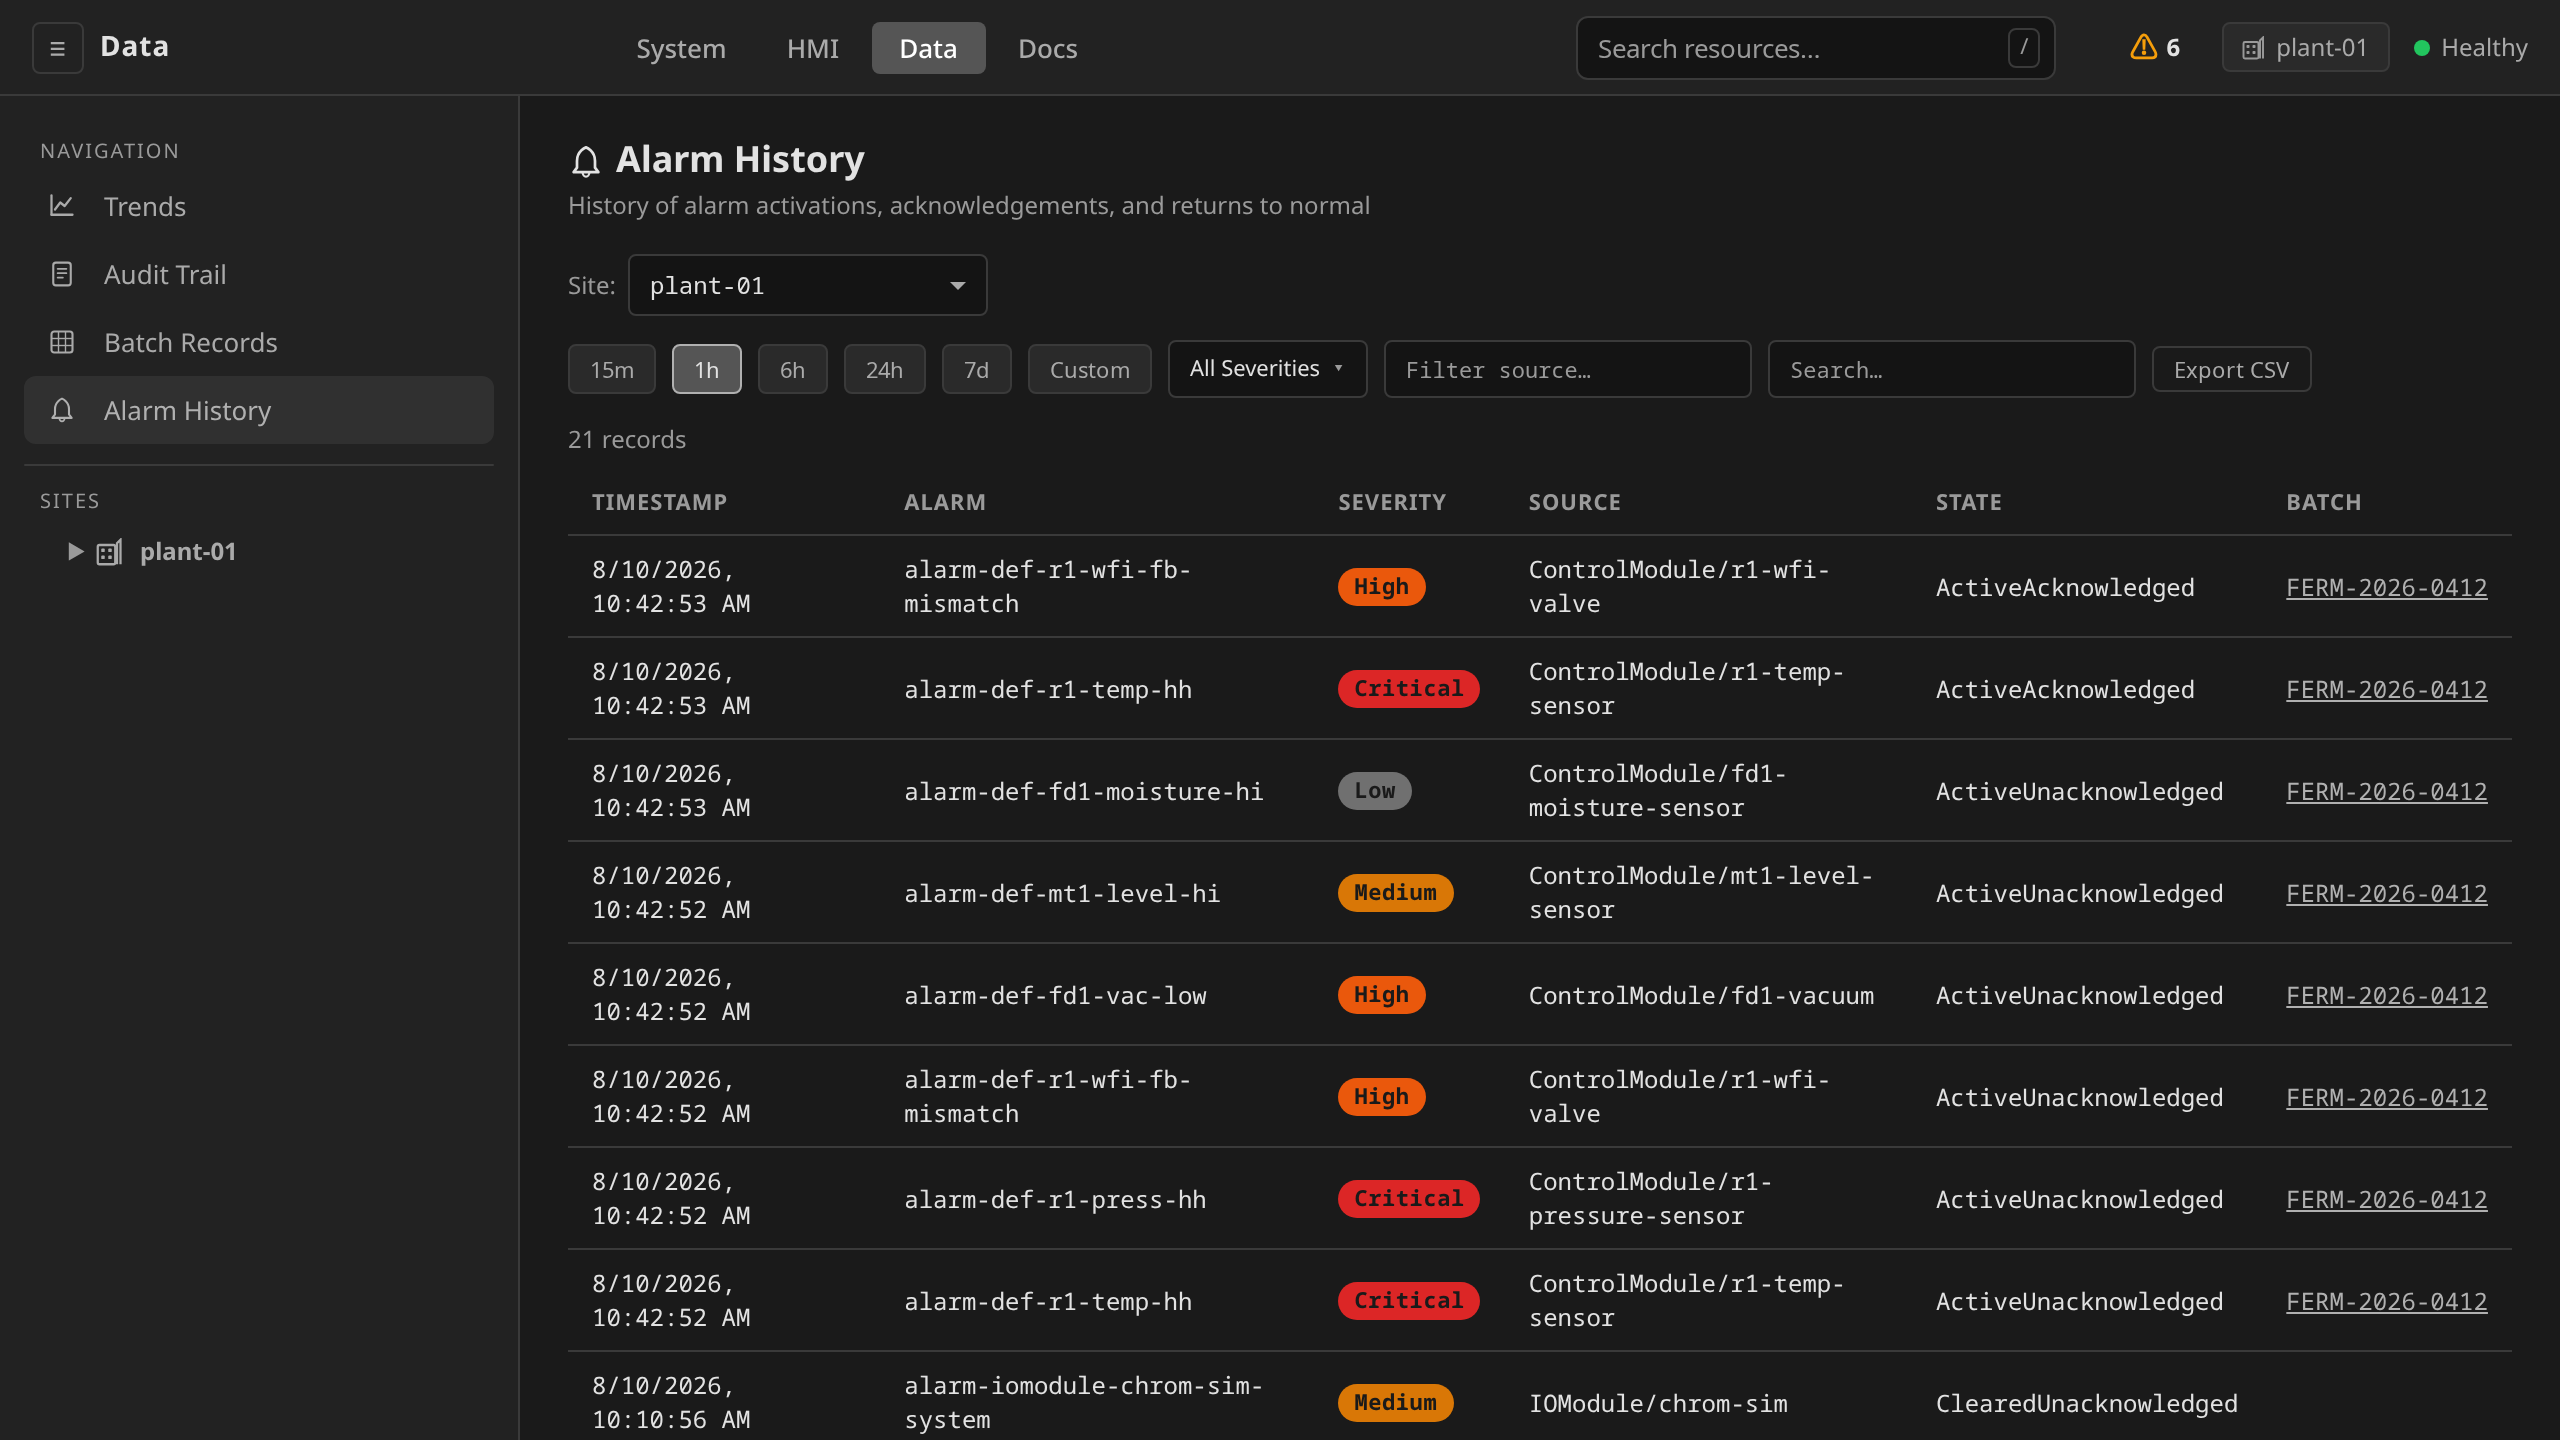
/data → Alarm History. Filter by site / area / process
cell / unit, severity, source, or time range. The table is flat:
one row per state transition, newest first. Narrow it to a single
alarm and the lifecycle reads top to bottom: activation,
acknowledgment, clear, return-to-normal.
The acknowledging operator is not a column in this table. Use Export CSV, the CLI, or the API to read it.
dcs historian alarms \
  --severity Critical \
  --from 2026-02-01T00:00:00Z \
  -s newark-plant
The ACK BY column carries the acknowledging operator. It is blank
on activation, clear, and return-to-normal rows. Those transitions
have no acknowledger.
GET /api/v1/historian/alarms?namespace=site-newark-plant&severity=Critical
Query parameters: namespace (required), source_kind,
source_name, alarm_name, severity, batch, start, end,
limit, offset.
Rows carry acknowledged_by on the two acknowledged states. The
field is omitted on every other transition. A consumer therefore
reads its absence as "no acknowledger", where "acknowledged by
nobody" would be a different and wrong claim.
State Transitions¶
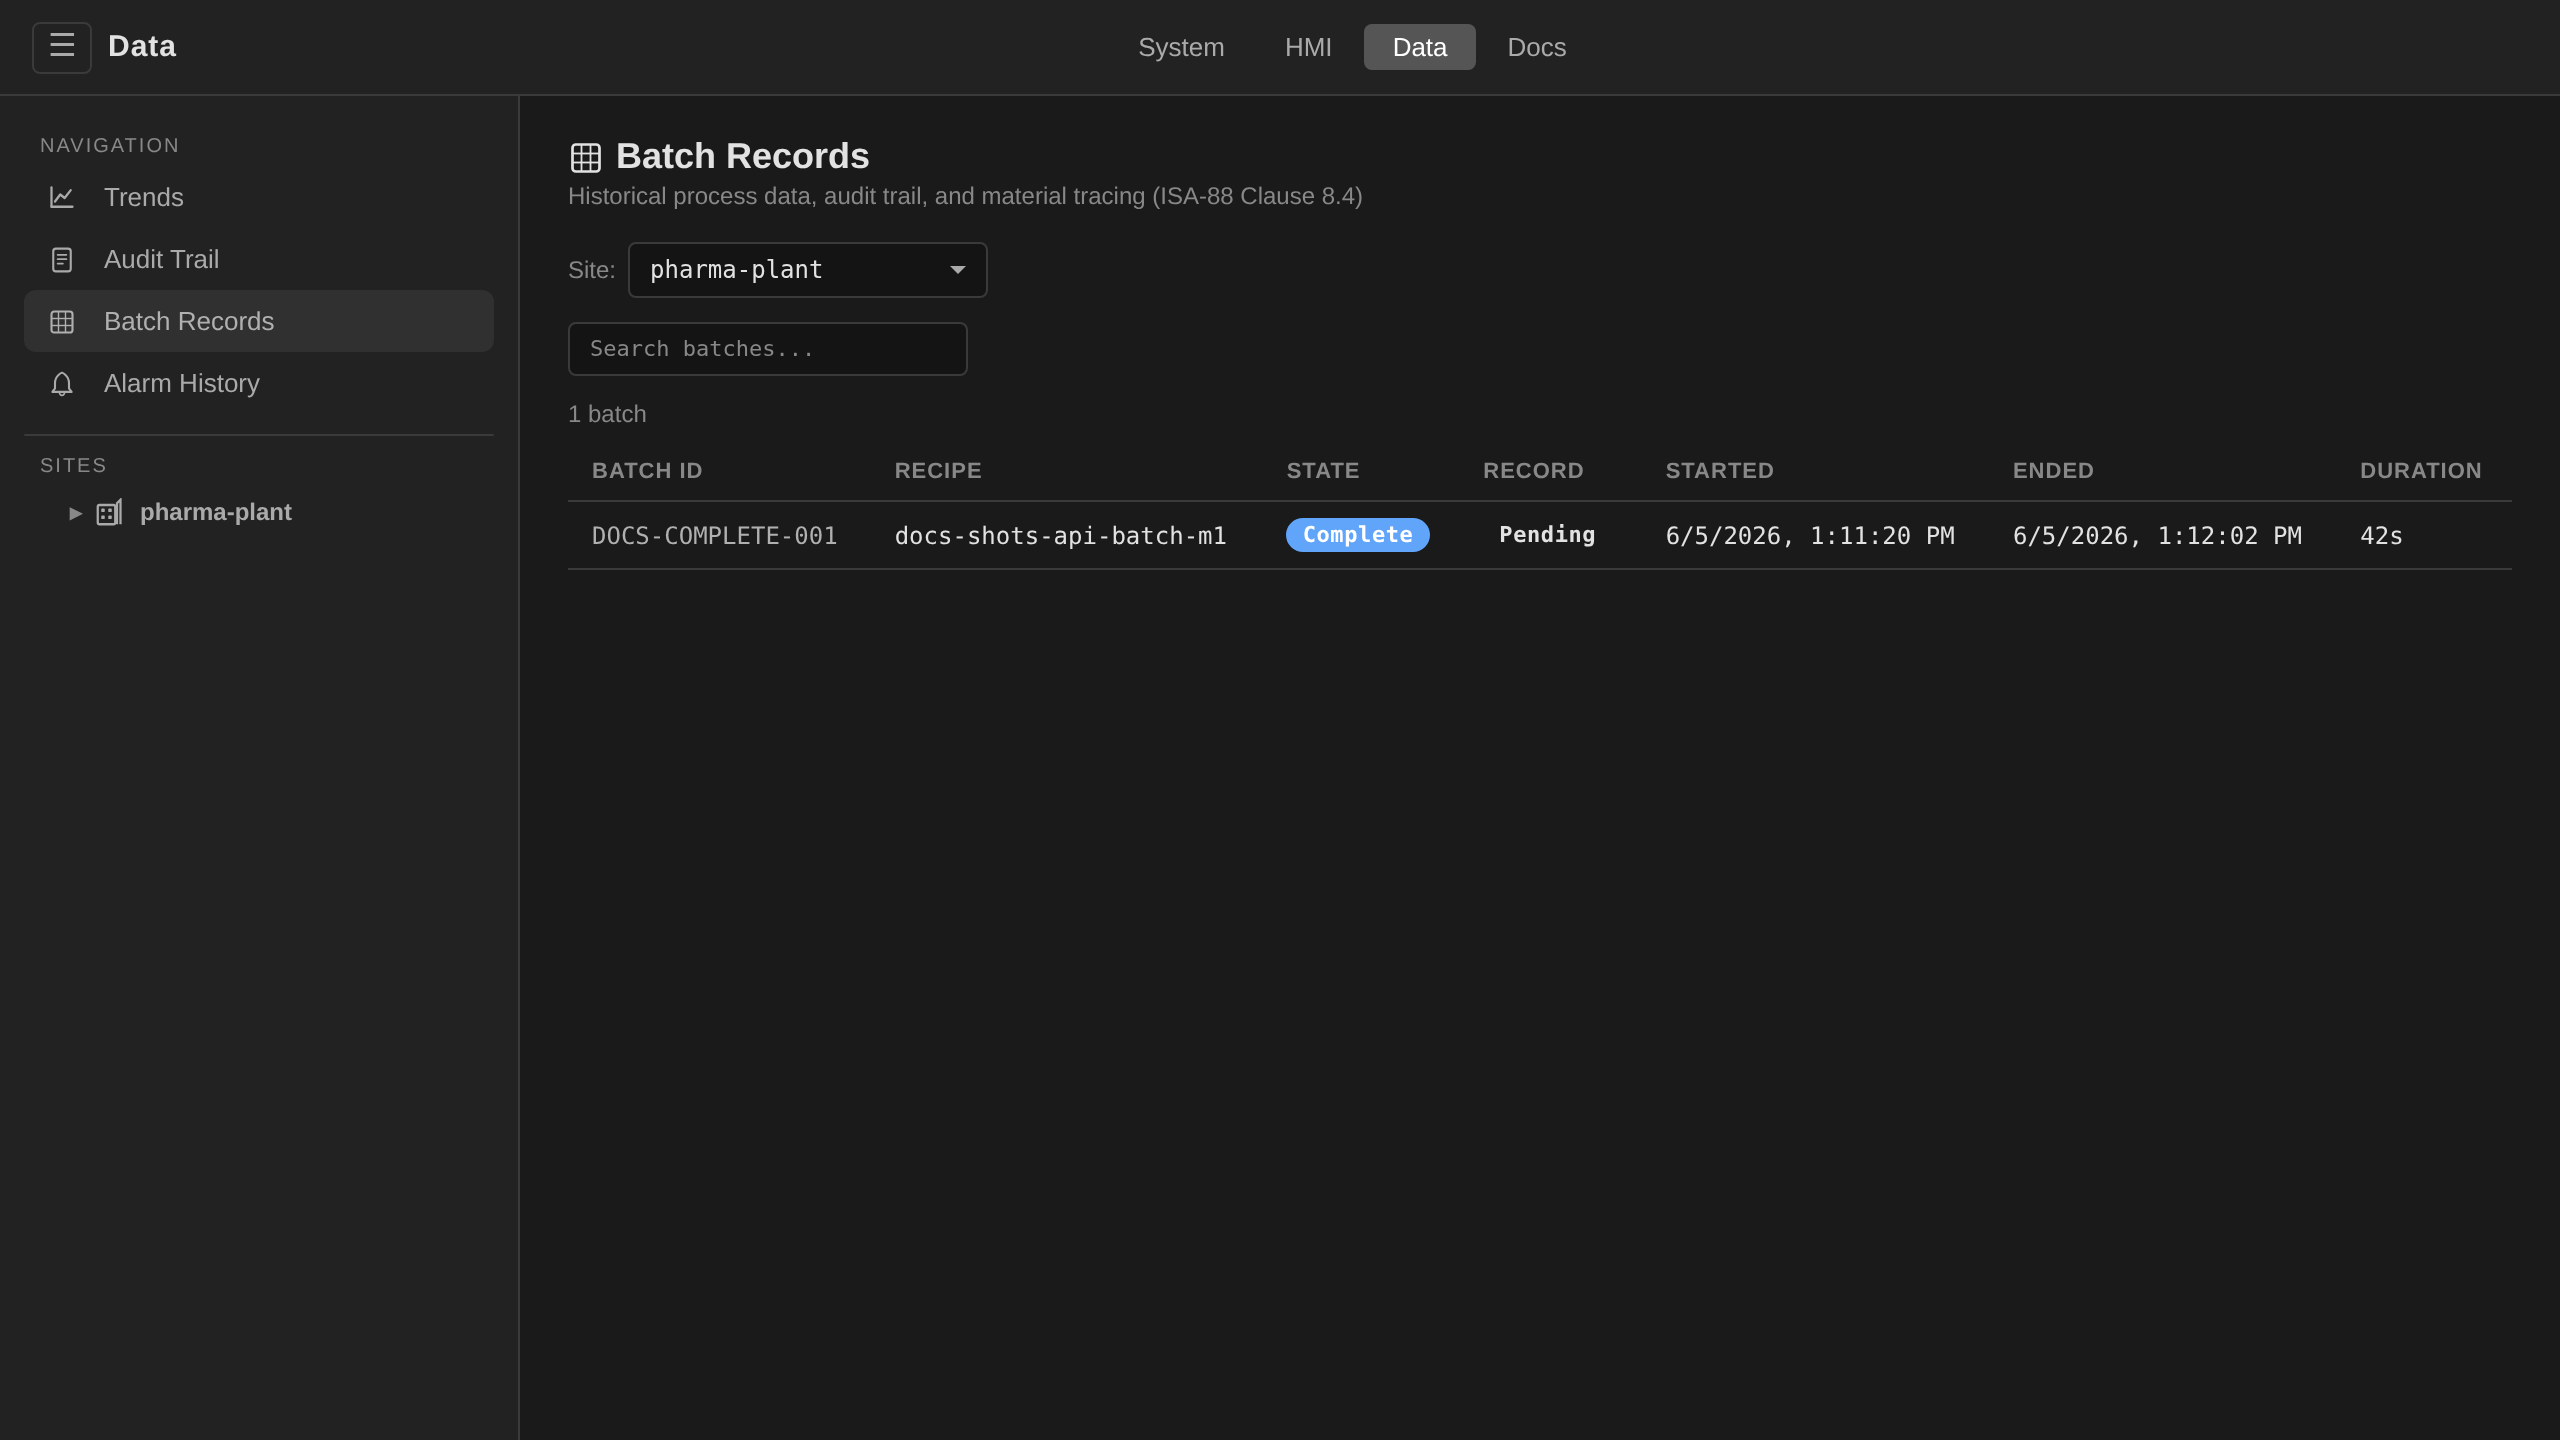
In the UI, state transitions surface in one place: the
consolidated BPR at /data → Batch Records includes the
full state-transition log scoped to the batch. No trend chart
(/data Trends or otherwise) overlays state markers. Trends show
time-series values only. For time-window queries across batches,
use the CLI/API tabs below.
dcs historian states \
  --kind Phase \
  --from 2026-02-01T00:00:00Z \
  -s newark-plant
GET /api/v1/historian/states?namespace=site-newark-plant&kind=Phase
Query parameters: namespace (required), kind, name,
batch, start, end, limit, offset.
Batch-Scoped Queries¶
Query all data associated with a specific batch:
/data → Batch Records → click the batch row. The
BPR pulls tags, alarms, and state transitions scoped to that batch
ID automatically, with no query building required.
dcs historian tags   --batch batch-20260225-001 -s newark-plant
dcs historian alarms --batch batch-20260225-001 -s newark-plant
dcs historian states --batch batch-20260225-001 -s newark-plant
GET /api/v1/historian/batch/batch-20260225-001/tags?namespace=site-newark-plant
GET /api/v1/historian/batch/batch-20260225-001/alarms?namespace=site-newark-plant
GET /api/v1/historian/batch/batch-20260225-001/states?namespace=site-newark-plant
Response Format¶
All JSON API responses share the shape:
{
  "data": [...],
  "total": 5000,
  "limit": 1000,
  "offset": 0
}
Ingest status and the loss record¶
Two endpoints answer what the ingester is doing with the data while its database is not taking it, and what it did with the data during an outage that is over (#2116). Both are proxied by the gateway under the same paths.
GET /api/v1/historian/ingest reads memory and never the database, so it
answers during the outage it describes:
{
  "retention": "1h0m0s",
  "maxRecords": 100000,
  "flushInterval": "1s",
  "types": {
    "tags": {
      "buffered": 100000,
      "overdue": 98912,
      "spanSeconds": 139.2,
      "dropping": true,
      "droppingSince": "2026-09-09T19:32:10Z",
      "dropped": 45371,
      "droppedByAge": 0,
      "droppedByCeiling": 45371,
      "droppedTotal": 45371
    },
    "alarms": { "buffered": 3, "overdue": 3, "spanSeconds": 2011.0, "dropping": false, "droppedTotal": 0 }
  }
}
buffered is how many records the historian holds: what has arrived since
the last flush, and what a running flush has taken out and not yet
delivered. On a healthy historian it is never zero for long, because
records arrive between ticks. overdue is how many of those have been held
past two flush cycles (#2127). A record younger than that is waiting for
the tick or is in the flush's hands. One older has seen a tick it was not
delivered by, and is waiting on the database. overdue is the count that
says the database is behind, and it is the count the gateway's Historian
card renders. spanSeconds is the age of the oldest held record. While
overdue is above zero it is the length of the outage read off the data.
flushInterval is the cadence the line is drawn from. dropping is true from the first drop until the
next successful flush, and the three counts beside it are that episode's
account by bound. droppedTotal is every record of the type dropped since
the process started. A closed episode is carried as lastGap until the
process restarts.
GET /api/v1/historian/gaps reads the ingest_gaps table, the durable
record of every episode. It takes start, end (RFC 3339, an episode
overlapping the window matches), type and limit, and answers newest
first:
{
  "items": [
    {
      "type": "tags",
      "startedAt": "2026-09-09T19:32:10Z",
      "endedAt": "2026-09-09T20:09:41Z",
      "dropped": 45371,
      "droppedByAge": 0,
      "droppedByCeiling": 45371
    }
  ],
  "total": 1
}
A trend with a hole in it is read against this table. The two counts by
bound call for different remedies, which is why they are kept apart. A record
dropped by age waited the whole configured retention, and the outage outlasted
it. A record dropped by the ceiling was thrown away before its time because
the memory bound bit first, and the answer is to raise --buffer-max-records
and the pod's memory limit together.
Health Endpoints¶
| Endpoint | Description |
|---|---|
GET /healthz |
Always returns 200 |
GET /readyz |
200 once the schema is prepared and the database answers, 503 with the reason otherwise |
GET /api/v1/historian/ingest |
What the ingester holds and what it has dropped, per record type, read from memory (#2116) |
GET /api/v1/historian/gaps |
The record of every loss episode, read from the database (#2116) |
GET /metrics |
Prometheus scrape endpoint |
Deployment¶
The historian needs PostgreSQL with the TimescaleDB extension installed
and allow-listed. The schema (pkg/historian/migrations/) creates
hypertables, applies compression policies, and registers retention
policies via add_retention_policy(). Without the extension the
migrations fail on the first create_hypertable() call. The historian
stays up and reports itself not-ready, and the pod log carries the failing
statement on every retry.
The Helm chart deploys the historian as a Deployment with a Service on port 8092. Database credentials are provided via a Kubernetes Secret. The database itself can be provisioned in one of two ways.
In the in-cluster mode the credential reaches the pod as a file (#2116).
An environment variable would be read once, at container start. A
CloudNativePG Cluster that is recreated mints a new
application password, and on the bench the historian sat on the old one for
the rest of a thirty-seven-minute outage because nothing restarted it. The
chart mounts the app Secret as a whole-volume Secret file. The kubelet
rewrites that file in place within its sync period, and the historian
re-reads it before every new database connection. Connections already open keep
working until the server closes them. deploy/helm/cloud-native-dcs/tests/historian-db-credential.sh
holds the mount to that shape, since a subPath mount is frozen for the
life of the pod and would undo the whole of it.
Mode 1 — In-cluster database (default)¶
historian.database.cnpg.enabled: true (the chart default) renders a
postgresql.cnpg.io/v1 Cluster resource that runs the
timescale/timescaledb-ha image inside the cluster. The
CloudNativePG operator must already be
installed.
This is what the riverbend example and the
reference cluster use. The operator owns end-to-end:
- Provisioning, version upgrades, and failover.
- WAL archiving to S3 when
historian.backup.enabled: true— see Backup and Recovery and the DR Runbook. - HA via
historian.database.cnpg.instances > 1.
See examples/newark-plant/19-historian-cnpg-cluster.yaml for a worked
CNPG cluster example.
Mode 2 — External database (externalURL)¶
Setting historian.database.externalURL to a postgres://… connection
string skips CNPG entirely. The historian and audit-archiver pods read
that URL via DATABASE_URL. Use this when pointing at a PostgreSQL
instance you operate yourself or a managed service.
The TimescaleDB requirement still applies. Practical compatibility for common managed offerings:
| Database | TimescaleDB extension | Works via externalURL |
|---|---|---|
| Self-hosted PostgreSQL with TimescaleDB | Yes | Yes |
| Timescale Cloud (managed by Timescale Inc.) | Yes | Yes |
| Aiven for PostgreSQL | Yes | Yes |
| Azure Database for PostgreSQL — Flexible Server | Yes (Apache-2 edition) | Yes |
| AWS RDS for PostgreSQL | No (extension not allow-listed) | No |
| GCP Cloud SQL for PostgreSQL | No | No |
| AWS Aurora PostgreSQL / AlloyDB | No | No |
If a deployment standard mandates a managed service that does not allow
the TimescaleDB extension, two workarounds are supported. Run
TimescaleDB yourself on a VM (EC2, GCE, on-prem) and treat that VM as
the external database, or use Timescale Cloud / Aiven, both of which
expose a standard postgres:// URL.
Choosing between the two modes¶
The application code, schema, and queries are identical in both modes. The split is purely in how the database is operated.
| Concern | In-cluster (CNPG) | External (externalURL) |
|---|---|---|
| Provisioning | Helm chart + CNPG operator | Provisioned by customer or provider; chart only consumes |
| Failover / HA | cnpg.instances > 1 |
Provider's responsibility |
| Backups | Integrated WAL → S3 (Backup and Recovery) | Provider's mechanism (e.g. Timescale Cloud snapshots) |
| Upgrades | CNPG-driven; chart guards immutable fields (Upgrade and Rollback) | Out of band, on the provider's cadence |
| Password rotation | Chart Secret + CNPG (Rotation Runbook) | Update the URL Secret manually; same runbook documents both paths |
| Network policy | Cluster-internal traffic | Egress to the external host must be permitted |
Starting without a database¶
The historian starts whether or not its database is there. It opens the connection pool without dialling, and a background loop then prepares the database: ping, migrate, set retention. A failed attempt is retried from the top with a delay that grows to 30 seconds.
GET /readyz answers 503 until that loop succeeds. The kubelet takes the
pod out of the Service for as long as it does. GET /healthz answers 200
throughout, so the pod is never restarted for a database that is late.
The readiness body names which of three conditions it found, because they send an operator to different places.
| Body | Meaning |
|---|---|
database schema not prepared |
No migration pass has completed yet. The pod log carries the reason each retry failed. |
database unavailable |
The schema is prepared and the database has stopped answering. |
database status unknown |
Nothing has looked at the database recently enough for the verdict to mean anything. This says something about the readiness gate and nothing about the database. Restart the historian pod. |
A background loop asks the database every five seconds and records what it
found. /readyz reads that recording and asks the database nothing itself.
It answers in microseconds whatever the database is doing. A ping that has
to re-dial a database which is not there takes two seconds or more. The
kubelet allows its readiness probe one second, and the gateway's Diagnostics
card allows its own two. Asking the database inside the probe meant the
sentence naming the condition often did not arrive, and one unchanging fault
rendered as three different messages (#1957).
Before #1950 the start path exited 1 on an unreachable database, on a failed migration, and on an unreachable MQTT broker. A database that was one second late therefore cost a restart, and CrashLoopBackOff's delay grows to five minutes. The running historian had always tolerated the same loss. Its ingester requeues the failed batch, holds records inside the retention and the ceiling described under Buffering and Flushing, and catches up when the database returns. The database is the historian's transport, and a transport that has not arrived is waited for.
The MQTT broker is treated the same way. The client connects in the background, and every subscription is registered for the first successful connect. A broker that comes up after the historian is picked up with no restart.
Schema migrations¶
The historian applies the SQL files embedded from
pkg/historian/migrations/ on its first successful connection to the
database, in filename order. Each file records its own version in the
schema_version table, and the migration pass applies only the files
numbered above the highest version already recorded. There is no per-file
bookkeeping, so the version number in a filename is the whole of what a
database knows about which migrations it has taken.
That makes one version per file an invariant, with the force a mere convention lacks. Two files at the same number are both skipped by any database that recorded that version, on that upgrade and on every upgrade after it. A duplicate now fails the build, and the historian refuses to apply anything at all when it sees one.
This happened once, in April 2026, and the databases it affected are
still out there. 003_cm_health_events.sql and the archive manifest
migration both claimed version 3, four days apart. A historian
database first migrated between 2026-04-17 and 2026-04-21 therefore
has the cm_health_events hypertable and does not have the
audit_archive_manifest table or the audit_records.manifest_id
column. The audit-archiver on such a database cannot write. That takes
out the 21 CFR Part 11 §11.10(c) tamper-evidence path, and
dcs audit verify --archived has nothing to verify against. The
manifest migration is numbered 005 as of the fix, so it reaches those
databases on their next historian upgrade with no manual step. Every
statement in it is idempotent, and a database that did receive the
original 003 re-applies it as a no-op.
To tell whether a database was in the window, read its schema against the historian database:
SELECT version, applied FROM schema_version ORDER BY version;
SELECT to_regclass('audit_archive_manifest') AS manifest_table;
A manifest_table of NULL on a database whose version 3 row predates
2026-04-21 is the affected state. Upgrade past the fix and re-run the
query. That is the only remedy needed.
Buffering and Flushing¶
The ingester buffers records in memory and flushes to the database either when the buffer reaches the configured size (default: 1000 records) or when the flush interval fires (default: 1 second), whichever comes first. Records are bulk-inserted using PostgreSQL's COPY protocol for efficiency.
On shutdown, all buffered data is flushed before the process exits.
What is held during an outage¶
A failed insert puts its batch back in front of the buffer, and further attempts back off to once every thirty seconds. Records keep arriving throughout, so the buffer grows for as long as the database is not taking them. Two bounds hold it (#2116), and each record is judged on how long the historian has held it. The record's own timestamp plays no part. A runtime replaying its store-and-forward backlog publishes records observed an hour ago, and judged by observation time they would be thrown away the moment they arrived.
The retention (--buffer-retention, default one hour) is how long a record
waits before it is given up. Its measure is an outage. The outage on record
is thirty-seven minutes of a node rebuild
followed by a credential the pod had only read at start, and the old bound
of ten flush buffers held about two minutes of the bench's arrivals against
it.
The ceiling (--buffer-max-records, default 100,000 per record type) is the
memory bound behind the retention, and it is measured (#2126). At the ceiling a tag record costs about 260 bytes of live heap at
the peak of a failed flush, read off the runtime by the test that holds the
ceiling against the chart's memory limit. The collector runs the heap out to
twice the live size before it collects. The default therefore models to
about 120 MiB resident with the idle process counted, inside the chart's
512 Mi limit.
The first default was 300,000, on an estimate of 250 bytes a record, and the
container's cgroup read the whole limit at that ceiling. At the bench's
seventy-odd tag records a second the ceiling is over twenty minutes away. At
a plant publishing a thousand a second it is under two minutes away, and it
then binds before the retention does. Raise the two together with the memory
limit. TestBuffer_CeilingFitsInsideTheChartMemoryLimit reads both from
the chart and is red when the pair does not fit.
The buffer is a ring. A drop at the ceiling moves an index and copies nothing, a failed batch goes back into the array it came out of, and the COPY to the database is built a row at a time. Each of those used to hold a second copy of the buffer at the peak, and the first cost a copy of the whole buffer per arriving record once the ceiling was reached.
The count and the age include the batch a flush is holding (#2125). A flush takes the oldest records out of the buffer for as long as the insert runs, and they are still waiting for the database while it does. The pool dials under the same ten-second bound the readiness ping uses. A refused dial fails at once. A black-holed one therefore costs a flush ten seconds, and not the two minutes pgx allows an unbounded dial.
The historian's Service publishes its address while the pod is not ready (#2124). Readiness turns on the database, and the gateway reads the historian's readiness body and its ingest account through the Service. Left at the default, the Service would withdraw the pod for exactly the outage the card is describing.
Every drop is counted, by bound, in three places. The log line says which
bound took the records and repeats at most once per thirty seconds while the
buffer keeps dropping, and it says the dropping stopped on the successful
flush that closes the episode and at no other moment. GET /api/v1/historian/ingest carries the open
episode's account, and the gateway's system card reads it beside /readyz
so a database outage says whether data is being lost or merely held. On the
first successful flush after an episode the ingester writes it to the
ingest_gaps table, which GET /api/v1/historian/gaps reads. A write that
fails is kept and retried after the next successful flush. The row is the
record of the loss, and unlike the records it is never given up.
What a row's timestamp means¶
The ts column on every table is the instant the observation was made, not
the instant the historian received the message (#1812,
ADR 0083). Each
publisher already declares it, and the ingester reads it off the payload:
| Table | Field on the wire | What it is |
|---|---|---|
tag_values |
Timestamp on the runtime's driver.TagValue |
The ADR 0027 observation time — when the value was last confirmed to reflect its source |
alarm_events |
timestamp |
When the alarm controller published the transition |
state_transitions |
timestamp |
When the publisher stored the transition it is announcing |
cm_health_events |
since |
When the control module entered the health state |
The two facts a reader has to know follow from that.
Rows can arrive late and out of order. A unit runtime holds a
store-and-forward queue on its own disk and drains it on the next connect. A
runtime promoted after a failover therefore replays whatever its last stint
left behind, which is readings minutes or hours old delivered in seconds. They
land where they were taken. TimescaleDB accepts them. A query that has already
run does not. dcs_historian_ingest_lag_seconds is where a drain is visible,
and dcs_runtime_mqtt_queue_depth says whether one is still outstanding.
A data gap is an interval with no observation. An interval with no delivery is a different interval, and only the first is a hole in the record. A gap measured while a backlog is still draining can legitimately shrink once that backlog lands.
Where the wire carries nothing usable, the row still has to be stamped with
something, so it takes arrival time. That is counted on
dcs_historian_ingest_time_fallback_total{type, reason} and is never silent. A
declared instant more than 30 seconds ahead of the historian's own clock is
refused as a clock fault and takes arrival time too. There is no bound in the
other direction, because an old timestamp is the replay case above.
21 CFR Part 11 Alignment¶
The historian's append-only data model supports several 21 CFR Part 11 requirements:
- Audit trail: All records are timestamped and immutable (no UPDATE/DELETE)
- Batch traceability: Records are tagged with batch IDs for end-to-end tracing
- Record retention: Configurable retention period with automatic cleanup
- Data integrity: PostgreSQL ACID transactions ensure durability
Compliance: See 21 CFR Part 11 traceability for the full requirements mapping.
Built-in Data Viewer¶
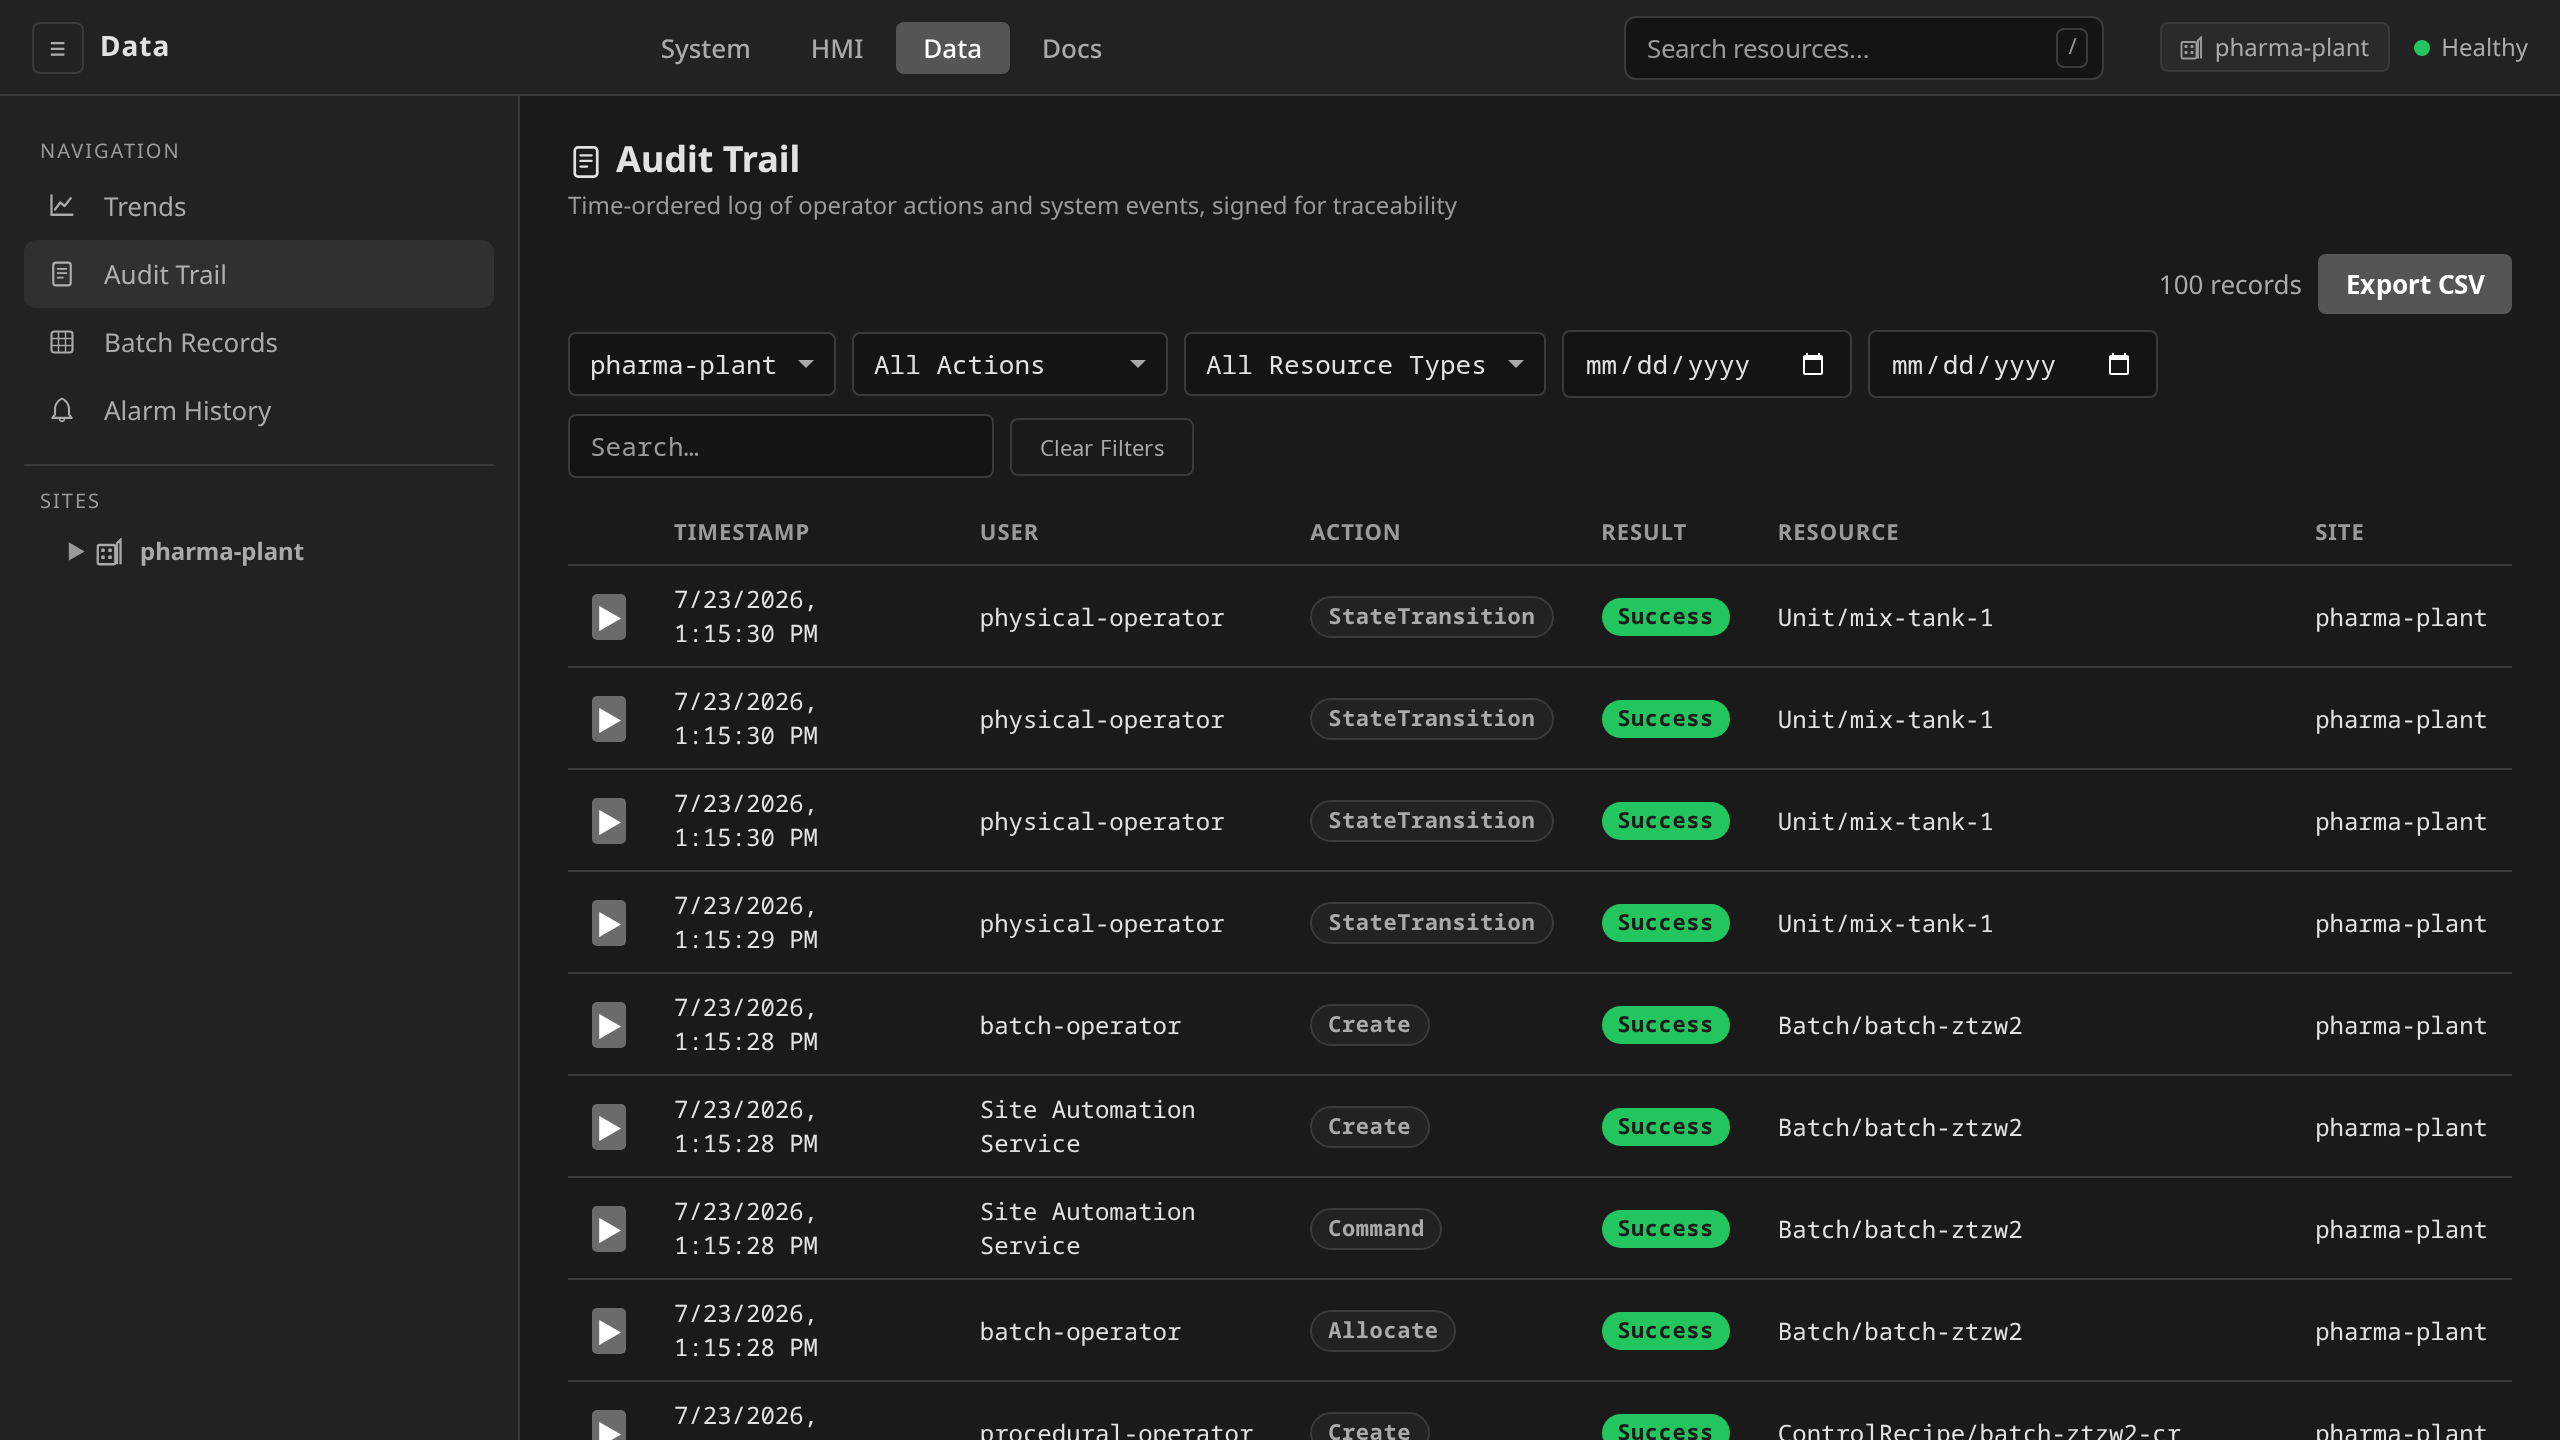
The gateway UI surfaces historian data through the four /data sidebar
items, Trends, Audit Trail, Batch Records, and
Alarm History (see Production Records Interface).
This is a convenience surface for quick lookups. Most users will use
external tools like Grafana for detailed analysis.
The gateway proxies historian API calls via HISTORIAN_URL (auto-configured
by the Helm chart when historian.enabled is true). When the historian is
not configured, the historian-backed /data views (Trends, Alarm
History) display a "historian not configured" message in place of the
chart or table. The Audit Trail still serves the recent records in etcd,
and Batch Records render regardless (see
Dependencies in Data Interface).
Querying from other tools¶
Nothing about reading process history depends on this product. The historian writes the ordinary PostgreSQL tables described in Database Schema, and the account it writes them with is an ordinary database user. Point a SQL client, a BI tool, or a dashboard at that database and those tables are what you get: no adapter, no connector, and no export step.
The built-in Trends view is not on a privileged path either. An
aggregated request builds time_bucket(<interval>, ts) with avg,
min, or max over value_num, grouped by tag. That is the same
query anyone else would write against tag_values. A chart drawn
elsewhere is therefore not an approximation of the built-in one.
Below, both run at once on the same week of one fermenter's temperature element: the Trends view on the left, Grafana on the right with the query typed by hand. The eight excursions land at the same eight timestamps, because there is only one series and one table underneath them. The two Y axes disagree on purpose. Trends pins the axis to the tag's configured engineering range, which is metadata the DCS holds about the tag and a generic SQL client has no way to know.
tag_values directly. Same excursions, same
timestamps, one table underneath both.Related Documentation¶
- MQTT Telemetry -- MQTT topic structure and client configuration
- Alarm Management -- Alarm lifecycle and MQTT publishing
- Monitoring and Metrics -- Historian-specific Prometheus metrics
- Architecture -- System overview