Production Records Interface
The Data endpoint (/data) provides production information views for
quality, management, and compliance users. It is the read-only window
into historical process data, batch production records, audit trail, and
alarm history. Unlike the HMI and System endpoints, all authenticated
users can access the Data endpoint regardless of role.
Sidebar Layout
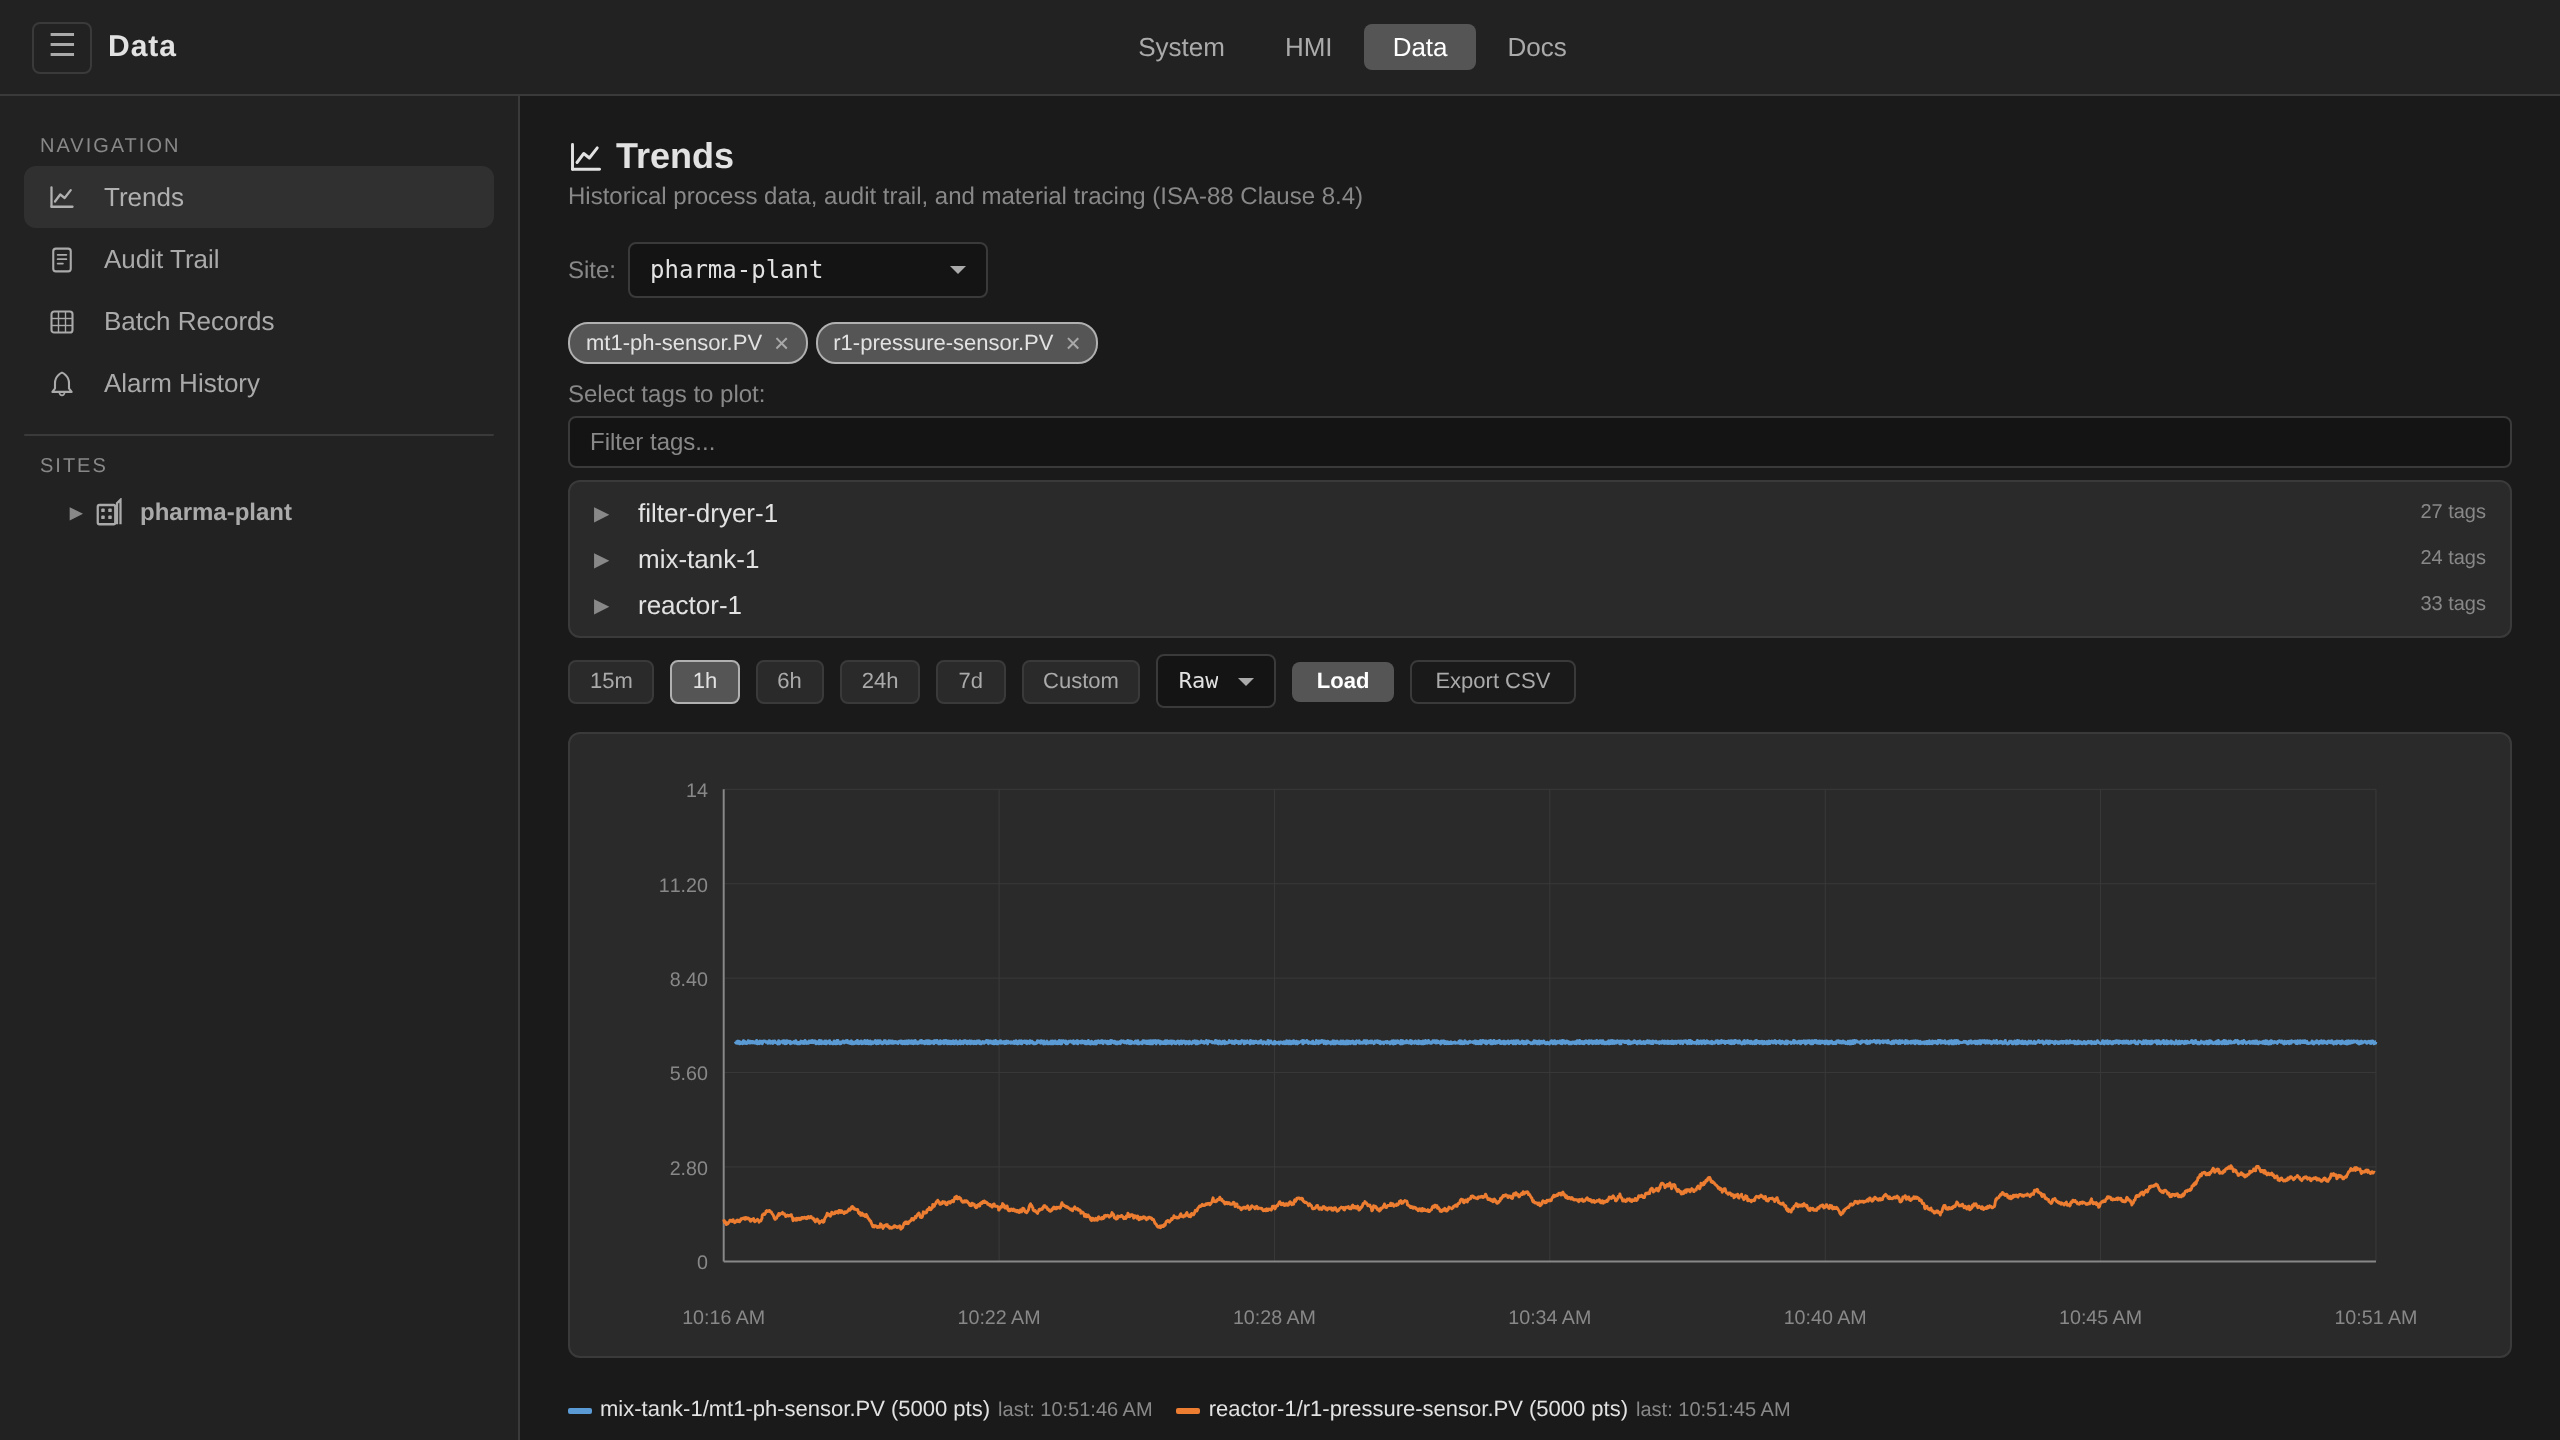
The Data sidebar has two sections:
- Navigation — top-level production information views: Trends, Audit Trail, Batch Records, Alarm History
- Sites — full physical hierarchy for scoping queries to a specific site, area, process cell, or unit
Trends
The Trends view renders multi-tag SVG trend charts against time-series data stored in the historian. Operators select tags from a grouped browser (organized by unit and control module), pick a time range, and the chart redraws with the historical samples.
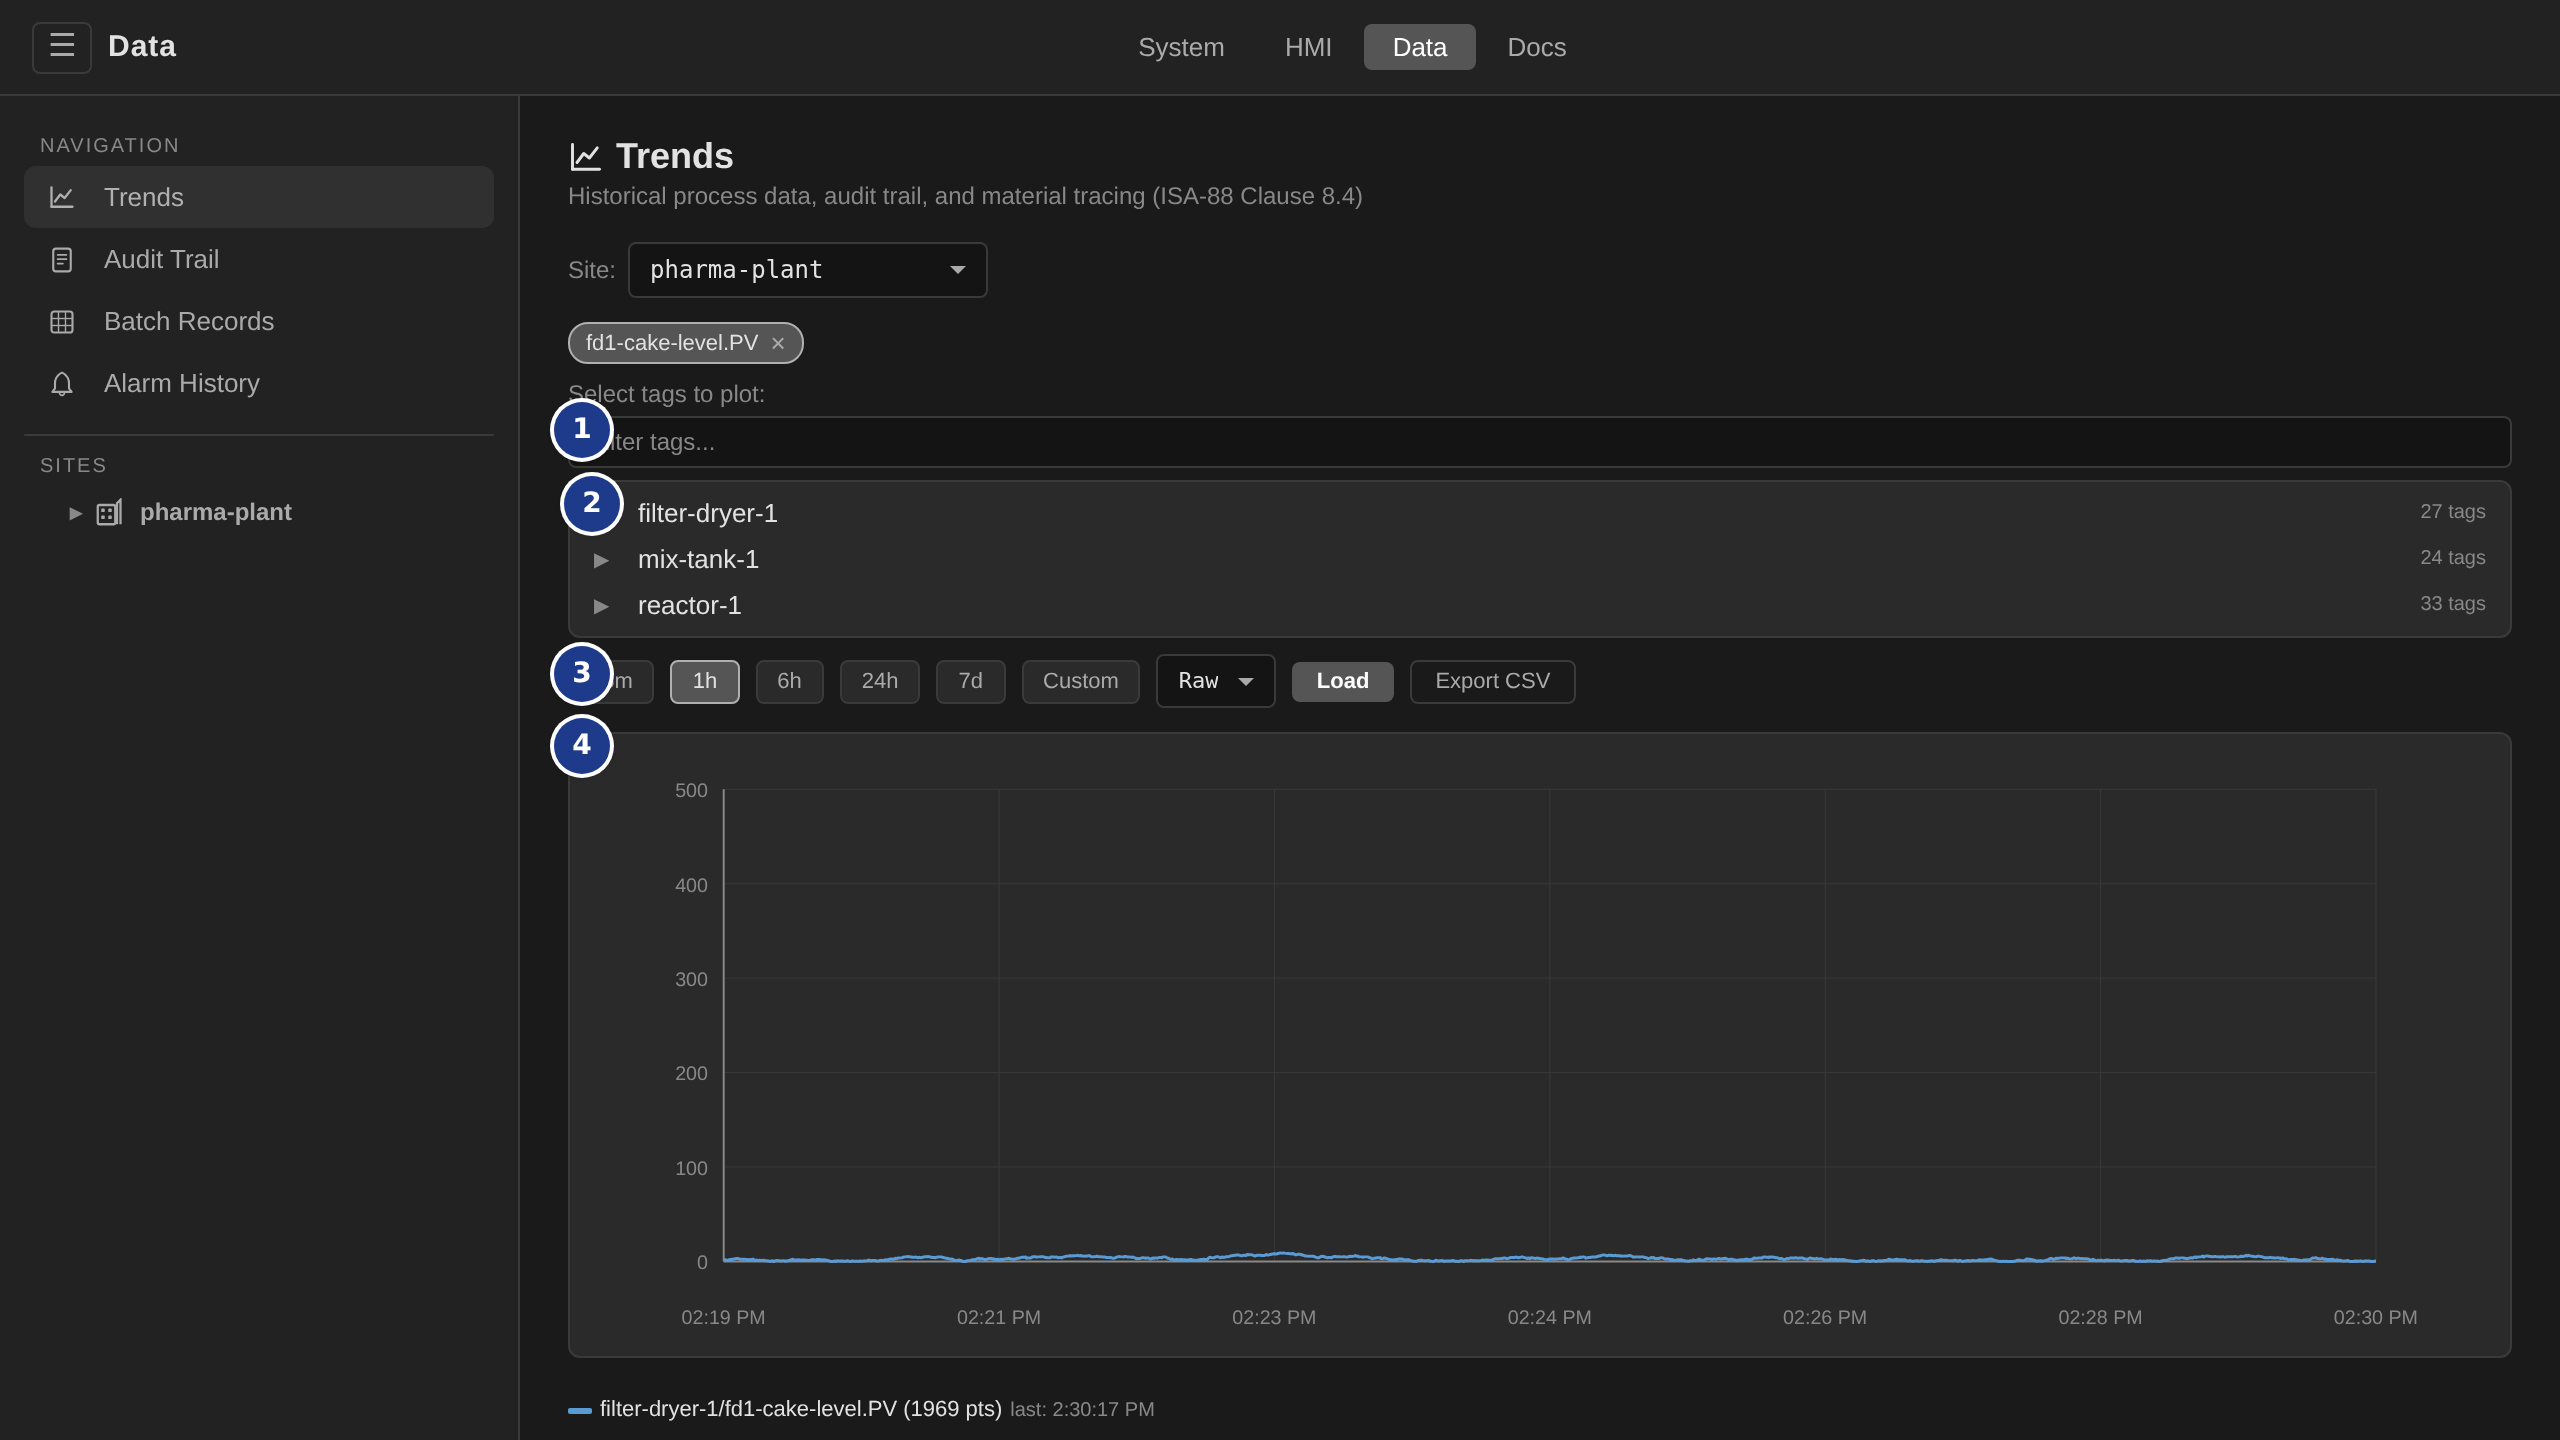
- Tag filter — substring filter that hides non-matching nodes and auto-expands matches.
- Tag tree — grouped by unit and control module. Click a unit to expand, then a leaf to add the tag to the chart. Up to 8 tags from different units can share one chart.
- Time range — 15 min / 1 h / 6 h / 24 h / 7 d presets, or a custom absolute window. Aggregation (Raw / Avg / Min / Max) and bucket interval sit to the right.
- Chart surface — multi-tag SVG. Y axes are fixed to the
engineering range configured on each tag (not auto-scaled from the
visible window), so the same tag looks the same across different
time ranges. The chart shows time-series values only. No trend
surface overlays state or alarm markers. The batch-scoped
state-transition log lives in the batch record,
and the historian's
state_transitionstable is queryable directly via CLI/API (see Historian). Export the plotted window to CSV from the chart toolbar.
The historian service must be running and reachable for Trends to work. See Historian for the ingestion pipeline and query API.
The whole surface runs below: trend building from the tag browser, the range stepping that proves the fixed engineering-range Y axis, and the sidebar drill into one module's trend and alarm history.
Audit Trail
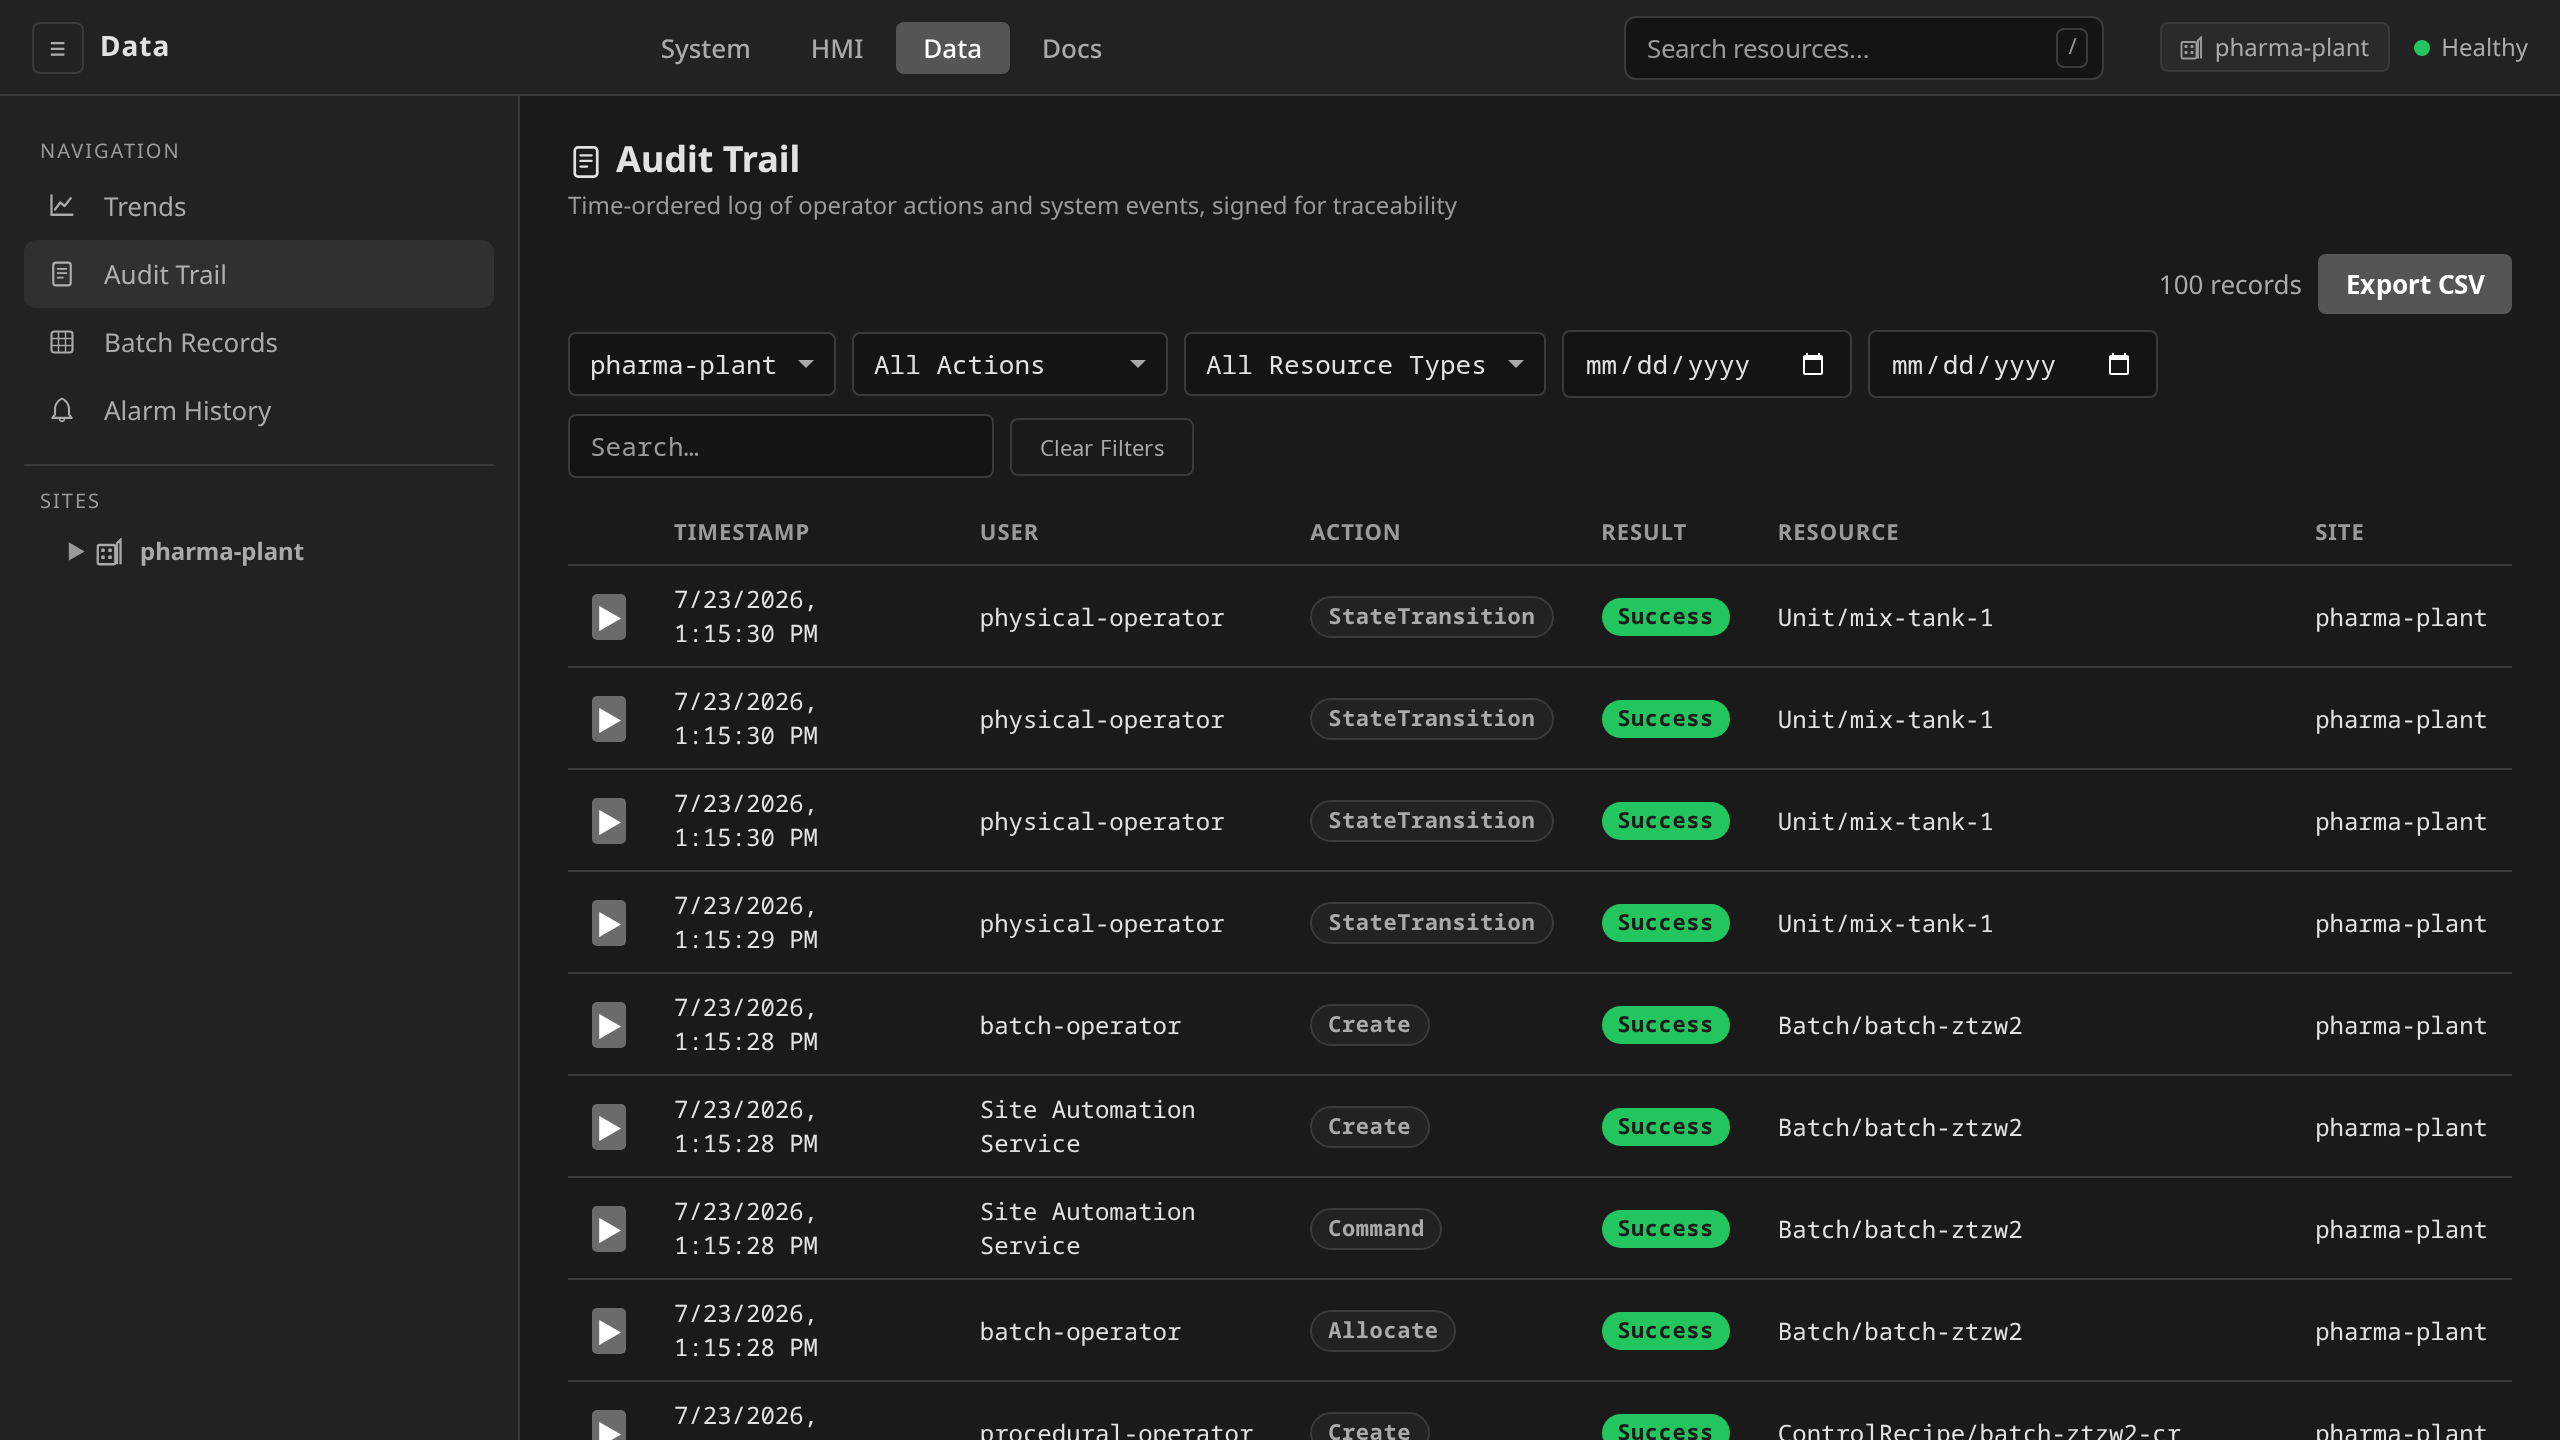
The Audit Trail view queries the 21 CFR Part 11 audit records stored by the audit archiver. Each record captures a state-changing action on a DCS resource with the user, timestamp, reason, and the old/new values.
| Field | Description |
|---|---|
| Timestamp | UTC timestamp of the action (millisecond precision) |
| User | Authenticated user identity (from OIDC or LDAP) |
| Action | create, update, delete, command, signature |
| Resource | Kubernetes resource kind and name (e.g. Batch/batch-001) |
| Reason | Operator-supplied justification for change-controlled actions |
| Signature | Electronic signature hash when required by Part 11 |
The query workflow runs below: the action filter, row expansion to the full old/new values, and the signature card (the filmed record is a batch Hold in the same trail).
Filters support narrowing by resource kind, action type, user, time range, and site. The Audit Trail view is the primary evidence source during FDA inspections.
See 21 CFR Part 11 compliance for the full audit trail requirements matrix and signature workflow.
Batch Records
The Batch Records view is the ISA-88 Part 4 batch production record (BPR) browser: one row per completed batch with recipe, outcome, duration, and finalization status. Selecting a row opens the consolidated record with collapsible sections and a print-friendly layout. See Batch Production Records for the BPR schema (parameter values vs process outputs), the finalization workflow, and BatchML export.
Alarm History
The Alarm History view queries historical alarm events from the historian. Filters include:
- Site, area, process cell, unit
- Severity (Critical, High, Medium, Low)
- Source (substring filter on the alarm source)
- Time range
The lifecycle arrives as one row per state transition. Filter the table to a single alarm name and its ordered history reads top to bottom: activation, acknowledgment, clear, and return-to-normal.
The table shows what each transition was. The
acknowledging operator is recorded against the acknowledgment
transitions, and it is carried by the Export CSV button, by
dcs historian alarms, and by the acknowledged_by field of the
/api/v1/historian/alarms response. It is not a column in the table,
because the table's width is already spent on the seven columns a
scanning read needs. For the active alarm view and ISA-18.2
lifecycle, see Alarm Management.
Dependencies
The Data views depend on the historian differently, and the fallback is per-view:
- Trends and Alarm History are historian-backed only: without a configured historian they display a "historian not configured" message in place of the chart or table.
- Audit Trail always serves the recent records still in etcd. When the historian is reachable it merges the archived records in, so a historian outage narrows the window and never empties the view.
- Batch Records are Kubernetes resources — they render without the historian.
For full historical queries, ensure the historian is reachable. See Historian for deployment and the MQTT-to-PostgreSQL ingestion pipeline.