Alarm Management
Operators respond to alarms in /hmi → Alarms. The view
lists every alarm in the current site, lets you filter by severity /
type / source, drill into detail, acknowledge, shelve, and unshelve. Alarmed
unit cards in the process-cell view also flag the condition with an
amber border so the alarm is visible without leaving the cell, and
each faceplate carries an inline Ack control for unacknowledged
alarms on its control module.
This page documents each operator action. Engineering setup (defining
which conditions raise an alarm) lives on the control-module page
(see Control Modules → Alarm definitions).
Worked patterns (valve mismatch, analog deviation, phase interlock)
are in Alarms and Interlocks. For
historical query, time-range filters, and severity post-processing
across resolved events, use /data → Alarm History (see
Historian).
Open the Alarms view
From the HMI sidebar, click Alarms. The view opens with the Active sub-tab selected and the current site's alarms in a table showing name, source, type, severity, condition (Active / Cleared), ack state, message, age, and per-row actions. A summary banner above the table totals counts by severity.
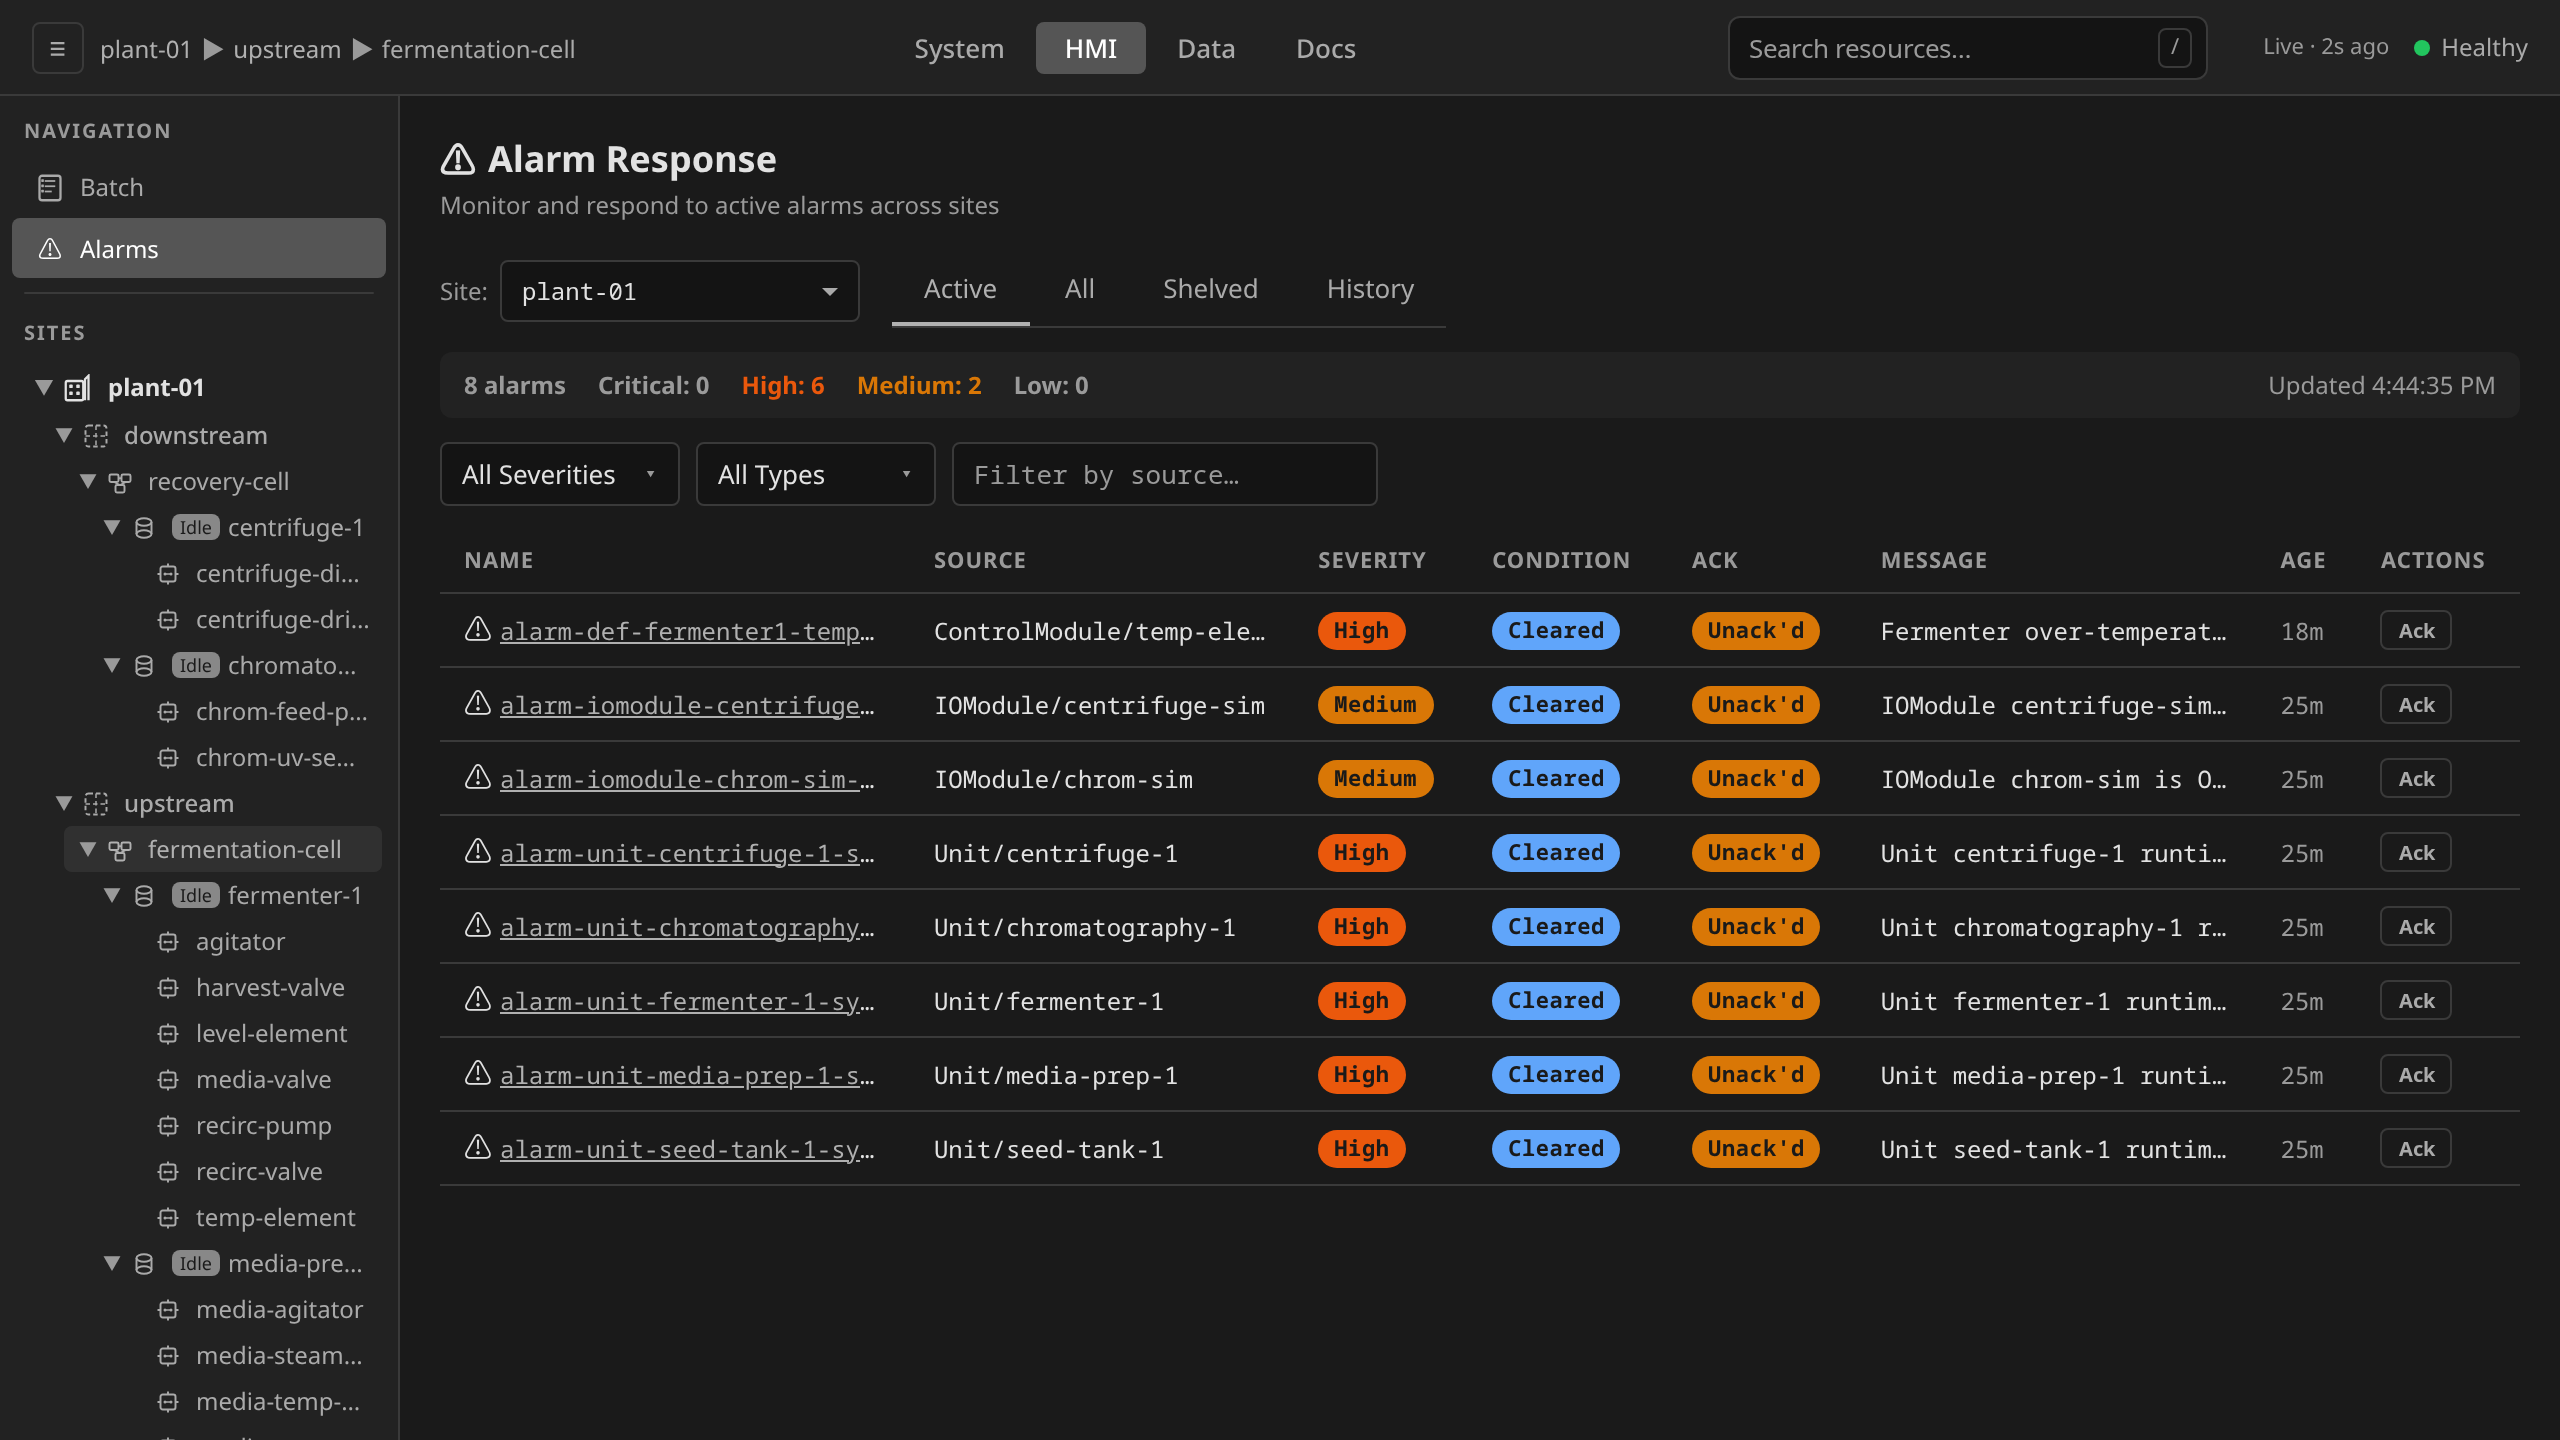
Alarm states
Every alarm follows the ISA-18.2 four-state model. Two independent flags, condition (Active / Cleared) and acknowledgement (Unack'd / Ack'd), combine to give the four states the controller drives the alarm through:
stateDiagram-v2
    [*] --> ActiveUnacknowledged: Condition met
    ActiveUnacknowledged --> ActiveAcknowledged: Operator Ack
    ActiveUnacknowledged --> ClearedUnacknowledged: Condition cleared
    ActiveAcknowledged --> ClearedAcknowledged: Condition cleared
    ClearedUnacknowledged --> ClearedAcknowledged: Operator Ack
    ClearedAcknowledged --> [*]: Resting (hidden from Active)
    ClearedAcknowledged --> ActiveUnacknowledged: Condition re-fires
    ClearedUnacknowledged --> ActiveUnacknowledged: Condition re-fires
The condition flag is owned by the alarm generator (driven by the
underlying tag value or source-state watch). The ack flag is owned by
the operator. Both must reach their resting value (Cleared +
Ack'd) before an alarm leaves the working set.
The two flags move independently, so a condition that returns
re-annunciates from either cleared state. Flapping equipment that
recovers before anyone acknowledges lands in ClearedUnacknowledged,
and the next occurrence still drives the alarm back to
ActiveUnacknowledged, relights the equipment cue, and republishes the
MQTT alarm event. Every occurrence gets its own annunciation, whatever
the operator did with the previous one.
Each state renders a distinct Condition + Ack badge pair in the alarms list, drives a different cue on equipment cards and faceplates, and gates which actions are offered:
| State | Condition | Ack | Equipment cue | Actions | If the condition returns |
|---|---|---|---|---|---|
ActiveUnacknowledged |
red Active | amber Unack'd | amber border + nav icon lit | Ack | already active, no change |
ActiveAcknowledged |
red Active | gray Ack'd | none (silenced while the condition stands) | Shelve (Unshelve while shelved) | already active, no change |
ClearedUnacknowledged |
green Cleared | amber Unack'd | none (no condition to flag) | Ack | → ActiveUnacknowledged |
ClearedAcknowledged |
green Cleared | gray Ack'd | none | (read-only) | → ActiveUnacknowledged |
ActiveUnacknowledged is the loudest state. The unit card
shows an amber border, the Alarms nav icon turns solid amber, and an
open faceplate carries an inline ack strip. Acknowledging silences
those cues immediately, even when the underlying condition is still
present.
When an alarm is deleted
Deletion is not one of the four states. An alarm is deleted when the AlarmDefinition that owns it is removed (removal garbage-collects its alarms), or when an engineer cleans up an orphan whose definition is already gone.
Both paths require acknowledgement first. The gateway refuses to delete
an alarm that is ActiveUnacknowledged or ClearedUnacknowledged, and
it refuses to delete an AlarmDefinition while any alarm derived from it
is in one of those states. An alarm nobody has acknowledged is a
condition nobody has accepted, so deleting it erases the annunciation
without that acceptance ever happening. Acknowledge the alarm and the
deletion goes through, leaving status.acknowledgedBy on the record of
who accepted the condition beforehand. Both refusals answer HTTP 409 and
are written to the audit trail as a rejected deletion
(ADR 0060).
Because deletion is not a transition, it has no alarm event of its own to ride, and the MQTT alarm event is retained. The alarm's last event would otherwise stand on its source's topic as the current truth for every consumer that connected afterwards. The alarm controller closes that: it clears the source's retained event and republishes the alarms that still exist on that source, so an annunciator, a SCADA bridge, or an HMI that connects a week later is never told about an alarm that no longer exists (ADR 0014).
Deleting an alarm is not a way to silence one. The generator recreates it on the next evaluation while its condition holds, and the operator tool for a nuisance alarm is shelving.
What the MQTT transport says about an alarm
The alarm event on dcs/{ns}/equipment/{kind}/{name}/alarm is retained,
so its last message is not a record of something that happened. It is
what every consumer that connects afterwards is told about that
equipment right now.
The alarm controller keeps it in agreement with the alarm. It fingerprints each alarm against the event last published for it and sends a new one when the two disagree, so a consumer holding the retained event holds the alarm's current state (ADR 0079).
This matters most for the alarms no AlarmDefinition raises. A watchdog Hold, a partial loss of field I/O, an expired lease, a runtime crash and a failover are raised by the operators that observe them, and those operators end the alarm by writing the cleared state onto it rather than by issuing a transition. One of them also rewrites a standing alarm's message when the fact underneath it moves, deliberately without re-annunciating. The fingerprint carries both, so Alarm History records the return to normal and an external subscriber is never left replaying an alarm that ended.
An unchanged alarm is not re-sent. A message on the topic is a change, not a heartbeat.
Reaction time
How quickly an AlarmDefinition fires after its condition first becomes
true depends on whether the condition is state-driven or
tag-driven, and on the debounceSeconds configured on the rule.
Reaction time is part of the AlarmDefinition contract. It is documented
here, and it is not a tunable. See ADR-0002
for the decision record and the alternatives that were considered, and
ADR 0007 for the protection
layering (device interlock / phase guard / alarm).
| Path | Reaction time (worst case) | Determinism | Use for |
|---|---|---|---|
Device interlock — DO/AO ILCK input or interlockAddress (see Pattern 0) |
One FB scan, 100–200 ms; always-on, mode-independent, survives control-plane partition | Deterministic; evaluated every scan on the edge | Equipment interlocks. Forcing a hazardous output to its safe state whenever a trip condition is true. |
Phase SFC transition guard at priority: -1 (see Pattern 3) |
One SFC scan cycle, 100–200 ms; only while the phase executes; requires the control plane | Deterministic; re-evaluated every scan | Procedural safe-state sequencing. Ordered multi-output responses that park the procedure in a resumable safe-hold. |
AlarmDefinition with StateEquals condition |
< 1 s (watch-driven) | Deterministic; fires within one reconcile of the source status update | State-based annunciation (IOModule fault, Unit offline). |
AlarmDefinition with any tag-based condition (TagHigh, TagLow, TagHighHigh, TagLowLow, TagDeviation, TagTrue, TagFalse) |
10 s poll + debounceSeconds — typically 10–60 s end-to-end |
Polled; bounded by the controller's 10 s tagEvalInterval |
Process-value annunciation, audit trail, batch-level exceptionAction. |
AlarmDefinition with DeviceHealth condition (ADR-0043) |
30 s device-health poll + < 1 s watch-driven evaluation | Watch-driven off the ControlModule's status.deviceHealth write; the 30 s floor is the control operator's poll cadence |
NE 107 instrument self-diagnosis annunciation. Which states alarm, and at what severity, is the definition's healthIn list — the platform mints no health alarm on its own. |
The 10 s poll cadence is the floor for tag-based reaction time. The
controller cannot fire a tag-based alarm faster than its next poll, no
matter how short the debounce. If an equipment constraint needs an
always-on stop (pump vs. closed valve), it is a device interlock:
Pattern 0.
If a process condition needs a sub-second sequenced response while a
recipe runs (overpressure surge, runaway exotherm), implement it as a
phase SFC transition guard at priority: -1. The worked example in
Alarms and Interlocks → Pattern 3
shows the recommended layered pattern: the guard sequences the
procedural safe-state, paired with a parallel AlarmDefinition at a
slightly higher threshold that fires only when the safe-hold action did
not recover. The device interlock protects the output. The guard
sequences the procedure. The alarm is the audit record and the
batch-level exceptionAction trigger.
BPCS-layer protection — an independent SIS is a PHA/LOPA decision
Even the phase-guard path is a BPCS-layer protection function. It is
not an SIS function under IEC 61508 / IEC 61511. Under IEC 61511
Clause 9.2 it can be credited as an independent protection layer.
Whether a given hazard (emergency shutdown, overpressure trip,
LEL/combustible-gas trip, relief-valve integrity, burner management)
also requires an independent SIS is a process-hazard-analysis
(PHA/LOPA) decision made per process. An independent SIS here means
a separate, independently certified safety PLC or hardwired trip
system. See
architecture.md for the full framing.
The All sub-tab is the only place every state is visible at once
(Active hides ClearedAcknowledged and shelved rows). Use it
when comparing badge cues or auditing recent alarm history. Use
Active for live operator response.
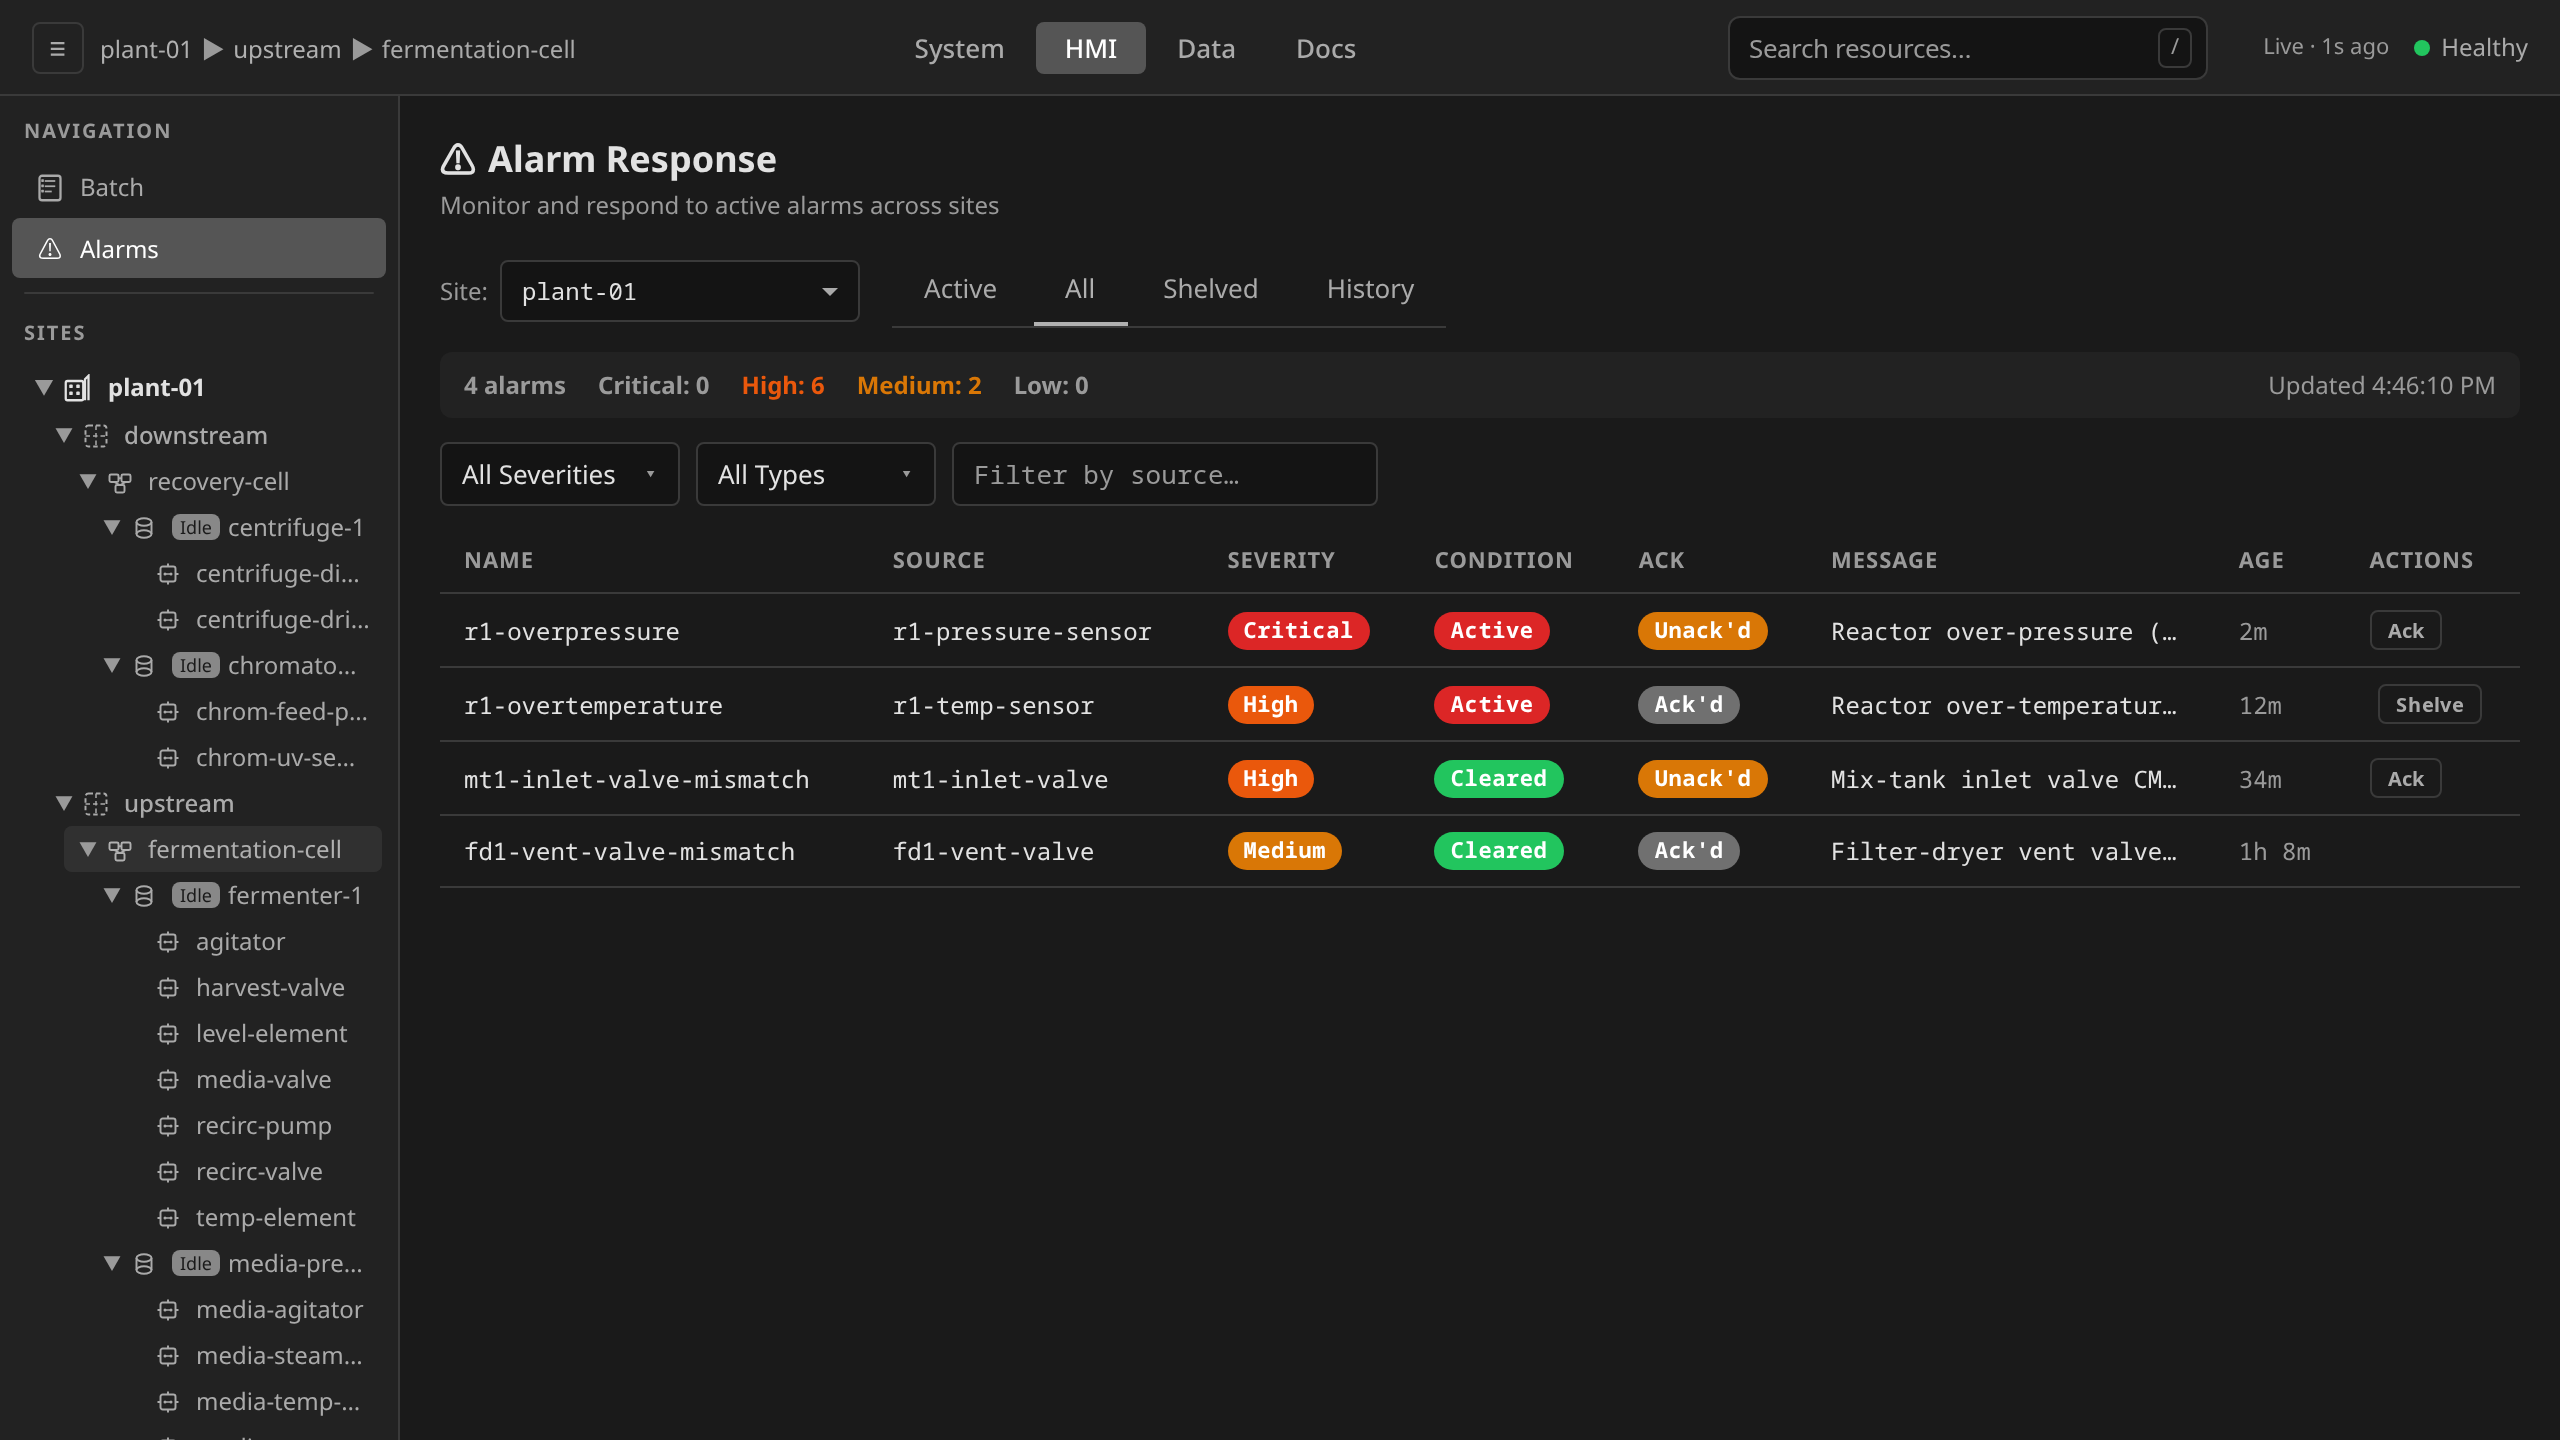
State is returned as the literal state field on each Alarm DTO
(ActiveUnacknowledged, ActiveAcknowledged,
ClearedUnacknowledged, ClearedAcknowledged). Filter the list
endpoint by adding &state=ClearedUnacknowledged etc. The UI
sub-tabs apply the same filter client-side.
Annunciate instrument health (NE 107)
A control module backed by a PA-DIM instrument mirrors the device's
NE 107 self-diagnosis into its status (see
Device health), and the
platform mints no alarm from it on its own: which states page
someone, and at what severity, is a site decision written as an
AlarmDefinition with the DeviceHealth condition
(ADR-0043).
On the control module's detail page, add a definition and pick Device Health (NE 107) as the condition. The condition is offered only when the source is a ControlModule. The state/tag inputs give way to the NE 107 state checkboxes: the alarm raises while the mirrored state is any of the ticked ones.
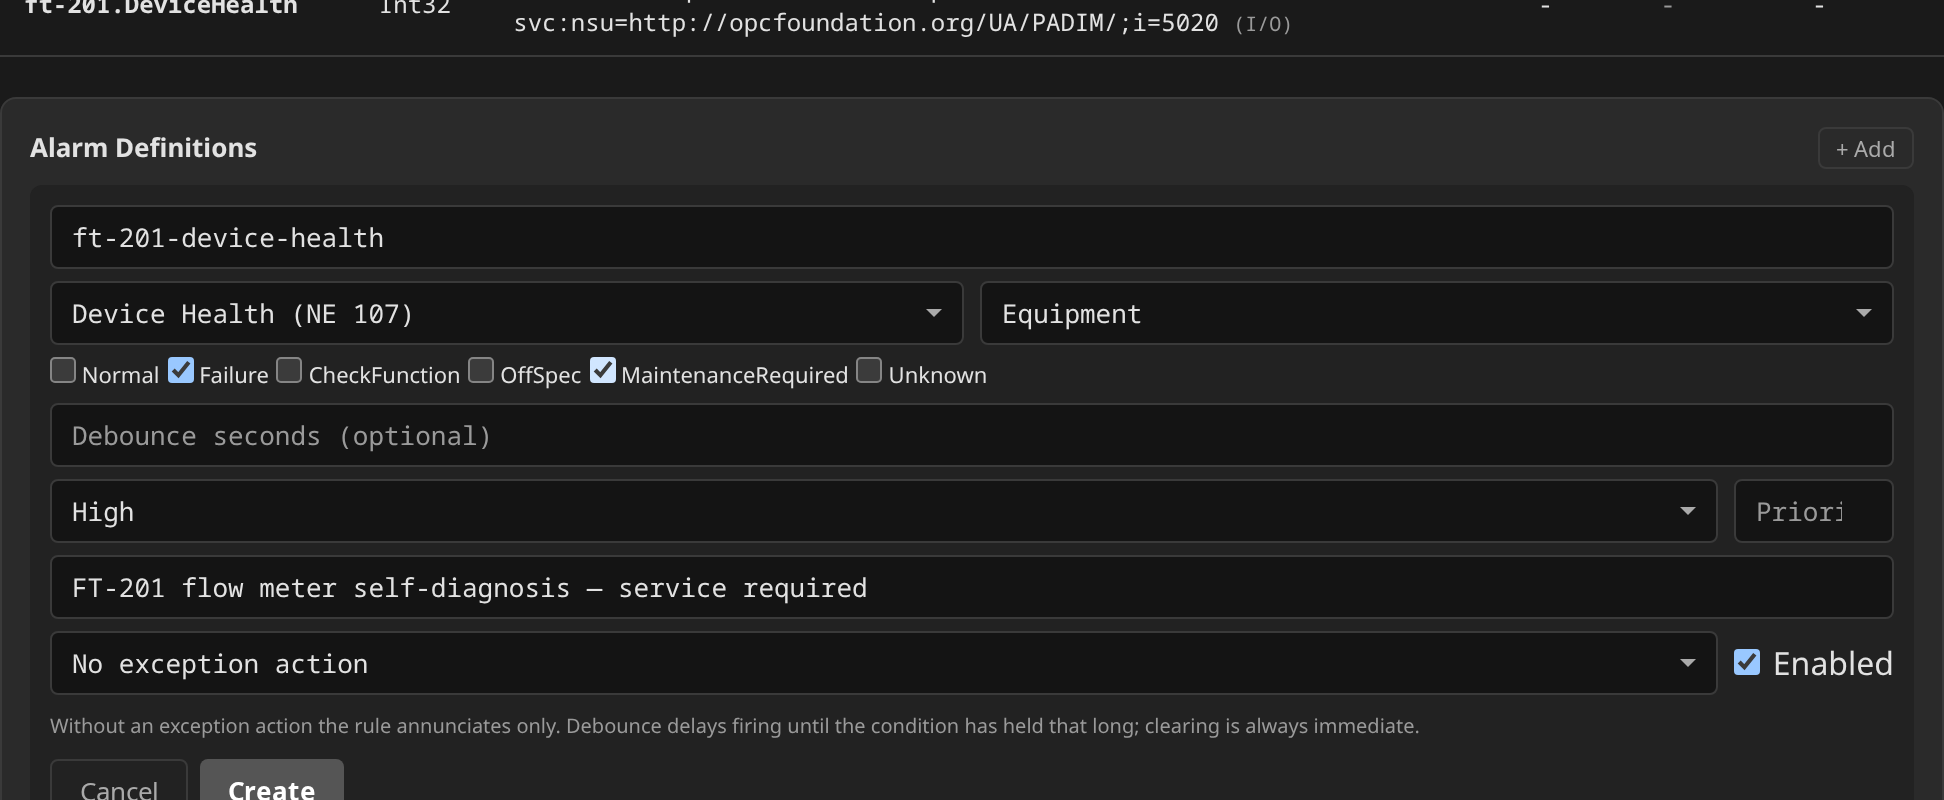
A typical policy alarms Failure at a high severity and
MaintenanceRequired at a low one, mirroring the DI taxonomy without
hard-coding it. Ticking Normal is legal but self-defeating. A lab skid
that deliberately lives in MaintenanceRequired for a week simply
leaves that box unticked. The created definition reads back as a
reviewable line of alarm policy:

Reaction time follows the device-health row of the reaction-time table: the 30 s poll cadence is the floor, evaluation off the status write is watch-driven and sub-second.
A maintenance system consumes the same definition's output as a feed it can cut work orders from. What it matches on, and where it reads the current health of the instruments that are fine, is in Device health for a maintenance system.
Confirm an exception action reached the batch
An AlarmDefinition that carries exceptionAction: Hold, Stop or
Abort commands the procedure of every running batch holding an
affected unit. The rule reports what happened on its own status, under
the ExceptionActionIssued condition.
A True condition means the action ran, and its message carries the
count: Issued Hold to 2 procedure(s). A count of zero is a successful
no-op, which is the normal reading when the alarm fires on equipment no
running batch has allocated.
A False condition means the action could not run at all, and its
message carries the reason. The alarm still annunciates, so the event
reaches the operator either way. No batch was commanded, and the
protection did not happen. The controller retries on every subsequent
pass until it succeeds, so a False condition that persists is a
standing failure worth escalating.
Read it with kubectl get alarmdefinition <name> -n site-<site>
-o jsonpath='{.status.conditions[?(@.type=="ExceptionActionIssued")]}'.
Server alarms
Most alarms come from the plant. A smaller set comes from the servers
themselves: the Kubernetes nodes running the operators, the gateway, the
broker and the historian. The physical operator watches those nodes and
raises the same kind of Alarm resource the plant rules raise, so
server degradation reaches you through the paths you already watch:
the Alarms nav cue, the topbar badge, the alarms list and history, and
the MQTT alarm topic any external annunciator subscribes to. The
decision record is ADR 0032.
| Condition | Severity | Source |
|---|---|---|
A control-plane node's Ready condition leaves True |
High | Server/<node> |
| A control-plane node is Ready and its etcd member is not serving | High | Server/<node> |
Any other node's Ready condition leaves True |
Medium | Server/<node> |
| A node reports memory, disk or PID pressure | Low | Server/<node> |
| Serving control-plane members fall below etcd quorum | Critical | Cluster/etcd-quorum |
| A node maintenance is still open past its alarm shelve window | Medium | Server/<node> |
A control-plane alarm carries the etcd margin in its message
(2 of 3 members serving, quorum size 2, margin 0), so a reboot that
holds quorum still tells you how much margin is left. The product does
not query etcd directly. Which members are alive is read off the API
server's own endpoints: on a stacked control plane every API server is
configured against the etcd member on its own machine, and it is listed
in the endpoints only while it can write its lease to that store. A
control-plane node that is Ready and absent from the endpoints is a
member whose store is dead behind a working kubelet. A cold boot
produced exactly that node on the bench, and it raises the second alarm
in the table. When the endpoints cannot be read, node readiness stands
in, and the message then says members Ready where it would say
members serving. Losing quorum outright raises its own Critical alarm.
These alarms behave like every other alarm: acknowledge to silence the
cue, shelve a nuisance for a bounded time, and read the history in
/data. The condition clears on its own once the node recovers.
Because the same servers host every site on the cluster, one server
condition raises one alarm in each site, and each site acknowledges its
own copy.
What a server alarm tells an operator
A server alarm annunciates on the HMI as well as in /system, and an
operator has no server surface to look the condition up in. So the
alarm carries its own interpretation, in a fixed order
(ADR 0037):
- What happened, in terms of what the plant loses. This sentence leads, so a truncated row in the alarm list still reads.
- Which of this site's unit runtimes were on that server. Each site gets its own copy of the alarm, so each copy names that site's own units. A site with nothing on the server is told so, which is how you learn the alarm does not threaten your batch.
- What to do, which is to escalate to whoever maintains the control system hardware. An operator console corrects none of these conditions, and the HMI carries no infrastructure action by decision.
- The engineering detail, kept last: the readiness status, the kubelet reason and the quorum derivation.
Reading a control-plane alarm, for example:
Server plant-cp-2, which runs the control system's management services, has stopped reporting. Unit runtimes keep executing their control logic. One more control-plane server failing will stop batch commands and configuration changes taking effect. No unit runtimes in this site are hosted on that server. Escalate to whoever maintains the control system hardware. An operator console cannot correct a server fault. Node detail: Ready status False, reason KubeletNotReady. etcd quorum derived from control-plane readiness: 2 of 3 members Ready, quorum size 2, margin 0.
Alongside the alarm, the health indicator in the top bar of every screen grades the servers with the rest of the system. It reads degraded while any server is unhealthy and critical when the cluster has lost quorum, so the state of the hardware underneath is visible without opening anything.
Planned maintenance shelves what it causes
Draining a node and rebooting it takes it out of Ready, which is the
alarm in the first row of the table. If every planned maintenance ended
in a burst of alarms describing what you just asked for, you would stop
reading the category, and the next real server fault would arrive in a
channel nobody watches.
So a maintenance shelves the alarms it is expected to cause. From the
moment a NodeMaintenance starts, the server alarms of the node it is
servicing are raised shelved: still in the alarm list, still in the
history, marked with their countdown, and annunciating nowhere. The
suppression rides the same retained MQTT event any external annunciator
already honours (ADR 0014),
so an outside horn falls silent along with the HMI.
The shelve is deliberately narrow. Another server leaving Ready, a
lost etcd quorum, and every equipment alarm in the plant annunciate
normally, because a real fault that merely coincides with a maintenance
window is still a real fault. A drain never evicts a running unit
either: a node hosting live unit runtimes is refused until they are
failed over, so there is no eviction burst to suppress.
It expires on its own two hours after the maintenance started, whether or not the node came back and whether or not anyone closed the object. A shelve that outlives its maintenance is itself a hazard, and the return path is exactly what fails when a maintenance goes wrong. Returning the node to service before then releases the shelve early.
A maintenance still open past that window raises the last row of the
table against the node, naming the intent, the phase and when the work
started, and the node's own conditions become audible again. A cordon
leaves a node perfectly Ready, so without that rule a chassis could
sit out of service for days with every indication green. Acknowledge it
like any other alarm when the job legitimately runs long.
The maintenance object carries the same story in its AlarmsShelved
condition, which names the instant the shelve expires while the window
is open and says so plainly once it has. An operator's own shelve on a
server alarm is left alone by all of this: maintenance releases only
the shelves it applied. The decision record is
ADR 0036.
The remedy is at the infrastructure layer. /system →
Servers carries the node detail behind the alarm: conditions,
capacity, roles, and the node-bound volumes that decide whether the
chassis can be serviced without moving data. See
Web UI → Servers.
Servers stay outside the ISA-88 physical model, so a server alarm never names a unit or a control module as its source. That also means it cannot be authored or tuned as an AlarmDefinition. The rules above are fixed.
I/O and control alarms
A third set comes from the equipment layer. The control plane raises these itself, and no alarm rule you author is involved.
| Condition | Severity | Source | Effect on a batch |
|---|---|---|---|
| Every field I/O driver on a unit has disconnected | Critical | Unit/<unit> |
ISA-88 Hold |
| Some of a unit's field I/O drivers have disconnected | High | Unit/<unit> |
ISA-88 Hold |
| A control program reports blocks faulted on its last scan | High | ControlProgram/<program> |
None |
An IOModule is in Fault |
High | IOModule/<module> |
ISA-88 Hold on every referencing unit |
An IOModule is Offline or Unknown |
Medium | IOModule/<module> |
None |
The Unknown half of the last row is narrower than the state is. Unknown
says the DCS has no measurement of a module, and a module nobody has measured
yet reads exactly the same as one whose probe has died. Only the second is
annunciated. Every IOModule is Unknown in the second it is created. The
discovery wizard's Apply emits one, and the probe answers about a minute later.
Until
#2064 each
one raised a Medium System alarm on its way in and left a
ClearedUnacknowledged alarm behind for an operator to dispose of. The alarm
named a fault nothing had observed.
What separates them is the module's ConnectivityMeasured condition, which
carries NoMeasurementTaken when nothing has asked and MeasurementLost when
something was answering and has stopped. The module page renders the same
distinction beside State, as not measured and measurement lost. Unmeasured
is not bad
(ADR 0074),
and an alarm is the one surface where asserting otherwise costs an operator
something.
The two driver-loss alarms name the drivers that went. An operator answering one is told which bus is missing, and not only that one is. They replace each other as the extent changes: a partial loss that becomes total clears the High and raises the Critical, and the reverse holds going the other way. A loss that grows or shrinks without crossing between the two refreshes the standing alarm's message rather than raising a second one. The alarm keeps its identity, its acknowledgement and its creation time. The interval from the raise to the clear still measures the one outage. The message names the buses that are missing now. The decision record is ADR 0078.
The control-program alarm names every block that faulted. It has no effect on the batch, because a program with a faulted block is still running and still driving every healthy output (ADR 0009). It is what annunciates a field write that failed. Before it existed, a phase could fail every write it made and the first thing an operator saw was a step timeout further down the recipe, which named a process fault.
All of them clear on their own when the condition ends.
Deleting the equipment is one of the ways a condition ends. An IOModule,
Unit or ControlProgram removed while one of these alarms is standing
leaves that alarm Cleared, in whichever acknowledged state it was in.
Without that, the annunciation would outlive the equipment it names, and
nobody could end it.
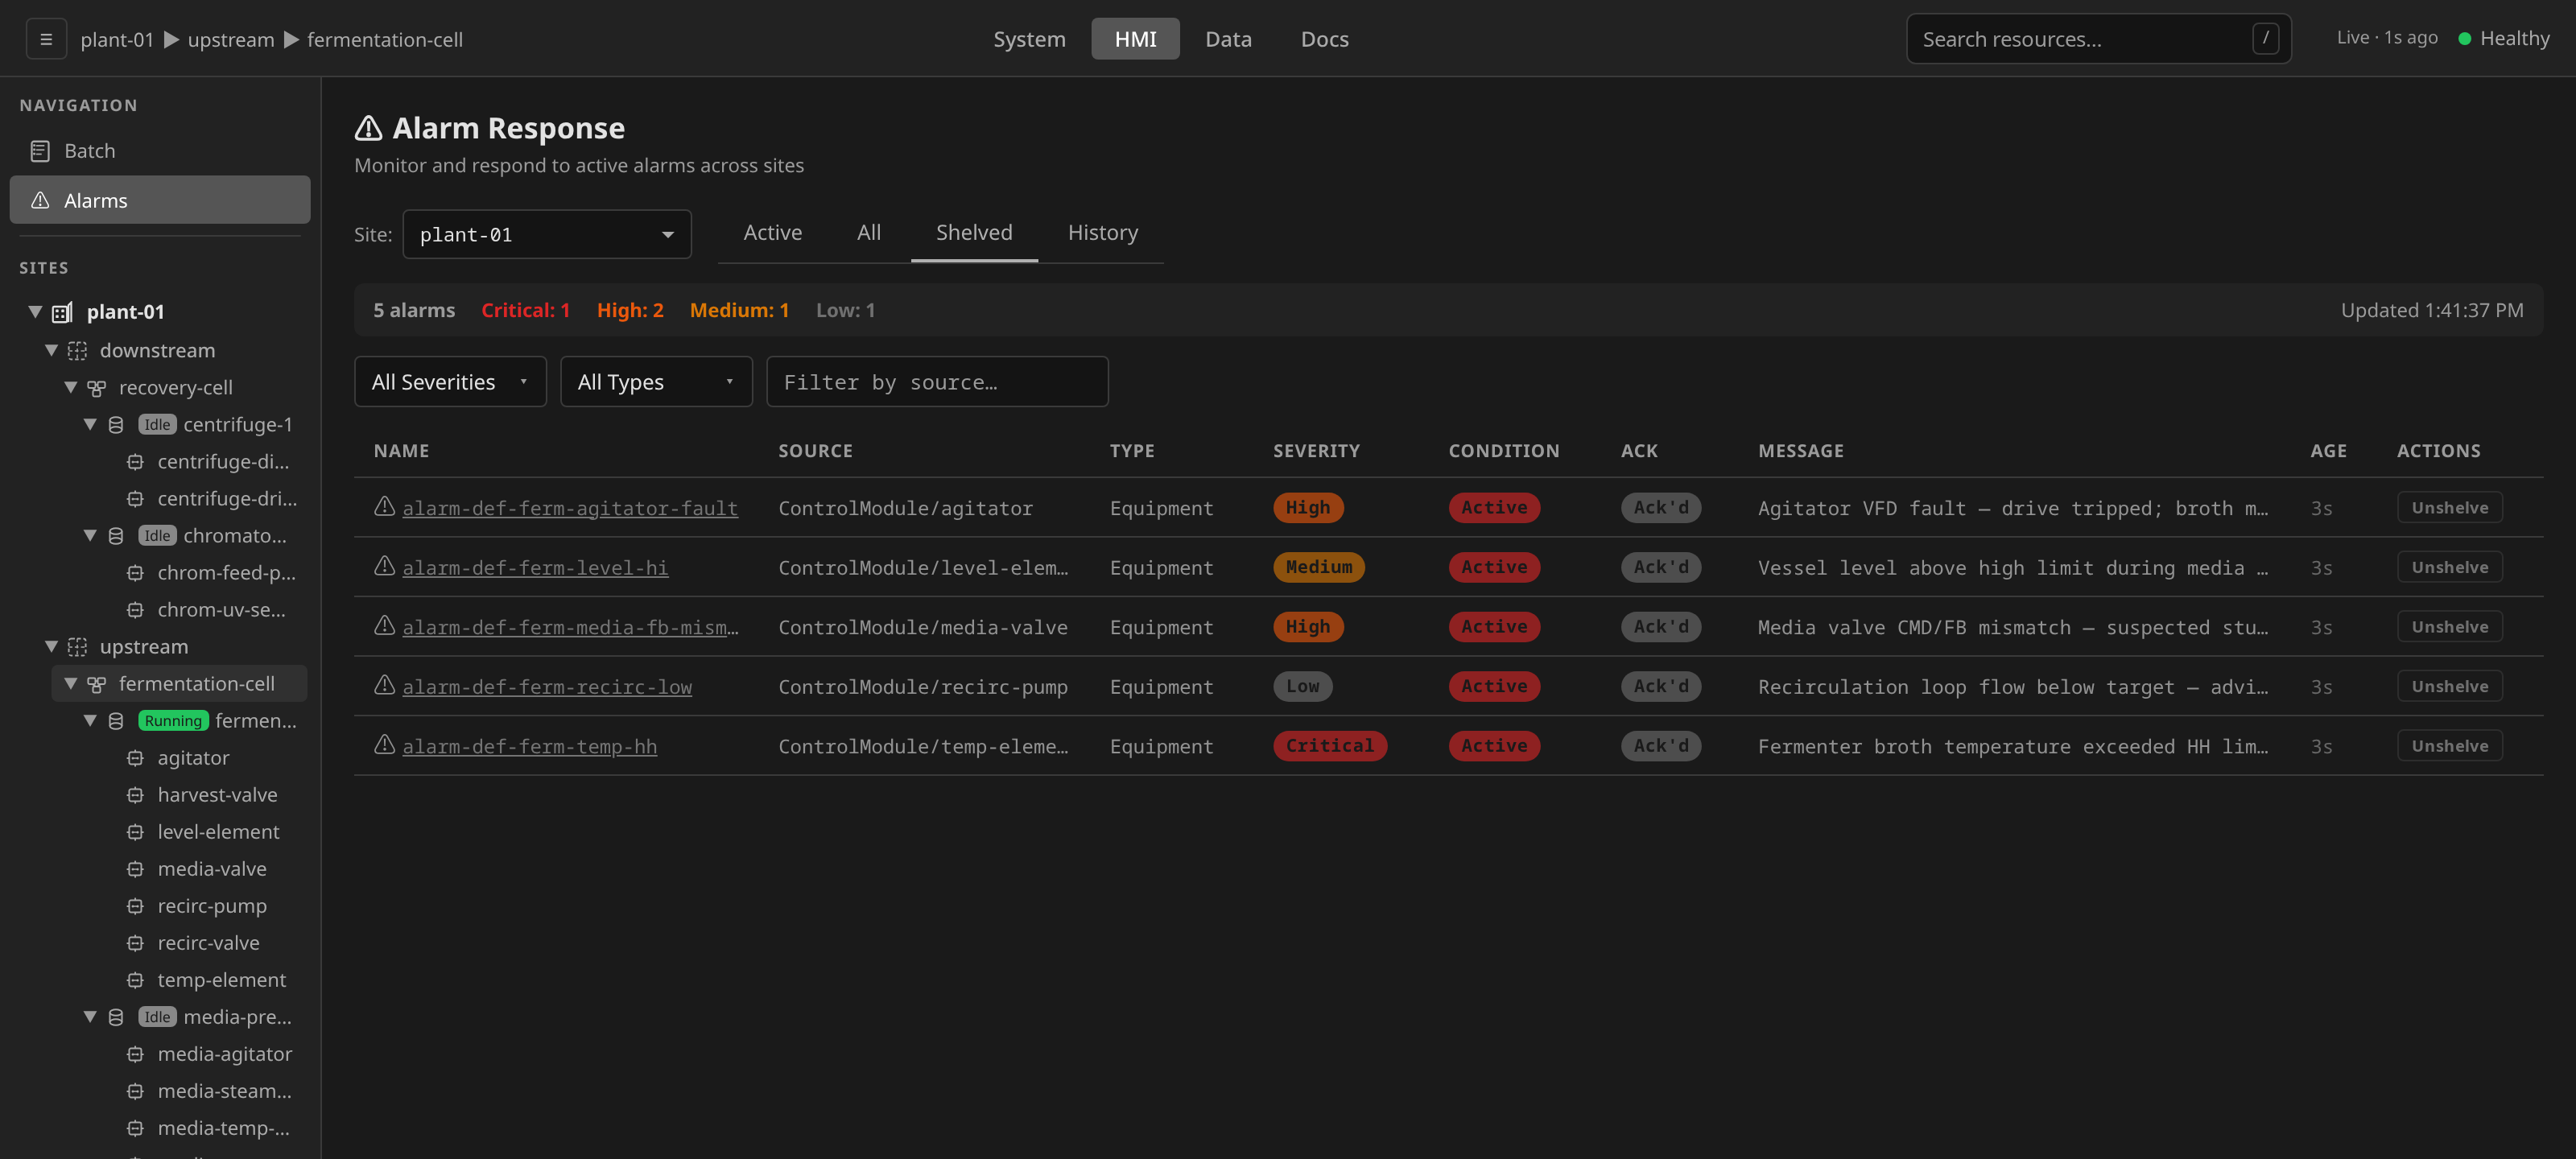
Switch between Active, All, and Shelved
The header above the table carries three sub-tabs. They filter the displayed list client-side. Switching does not re-query the gateway.
Active
Default selection. Hides shelved alarms (shelvedUntil in the future)
and resolved alarms (ClearedAcknowledged). This is the working set
operators react to in real time.
All
Every alarm in the site, regardless of state. Shelved rows render dimmed. Resolved rows are visible for context.
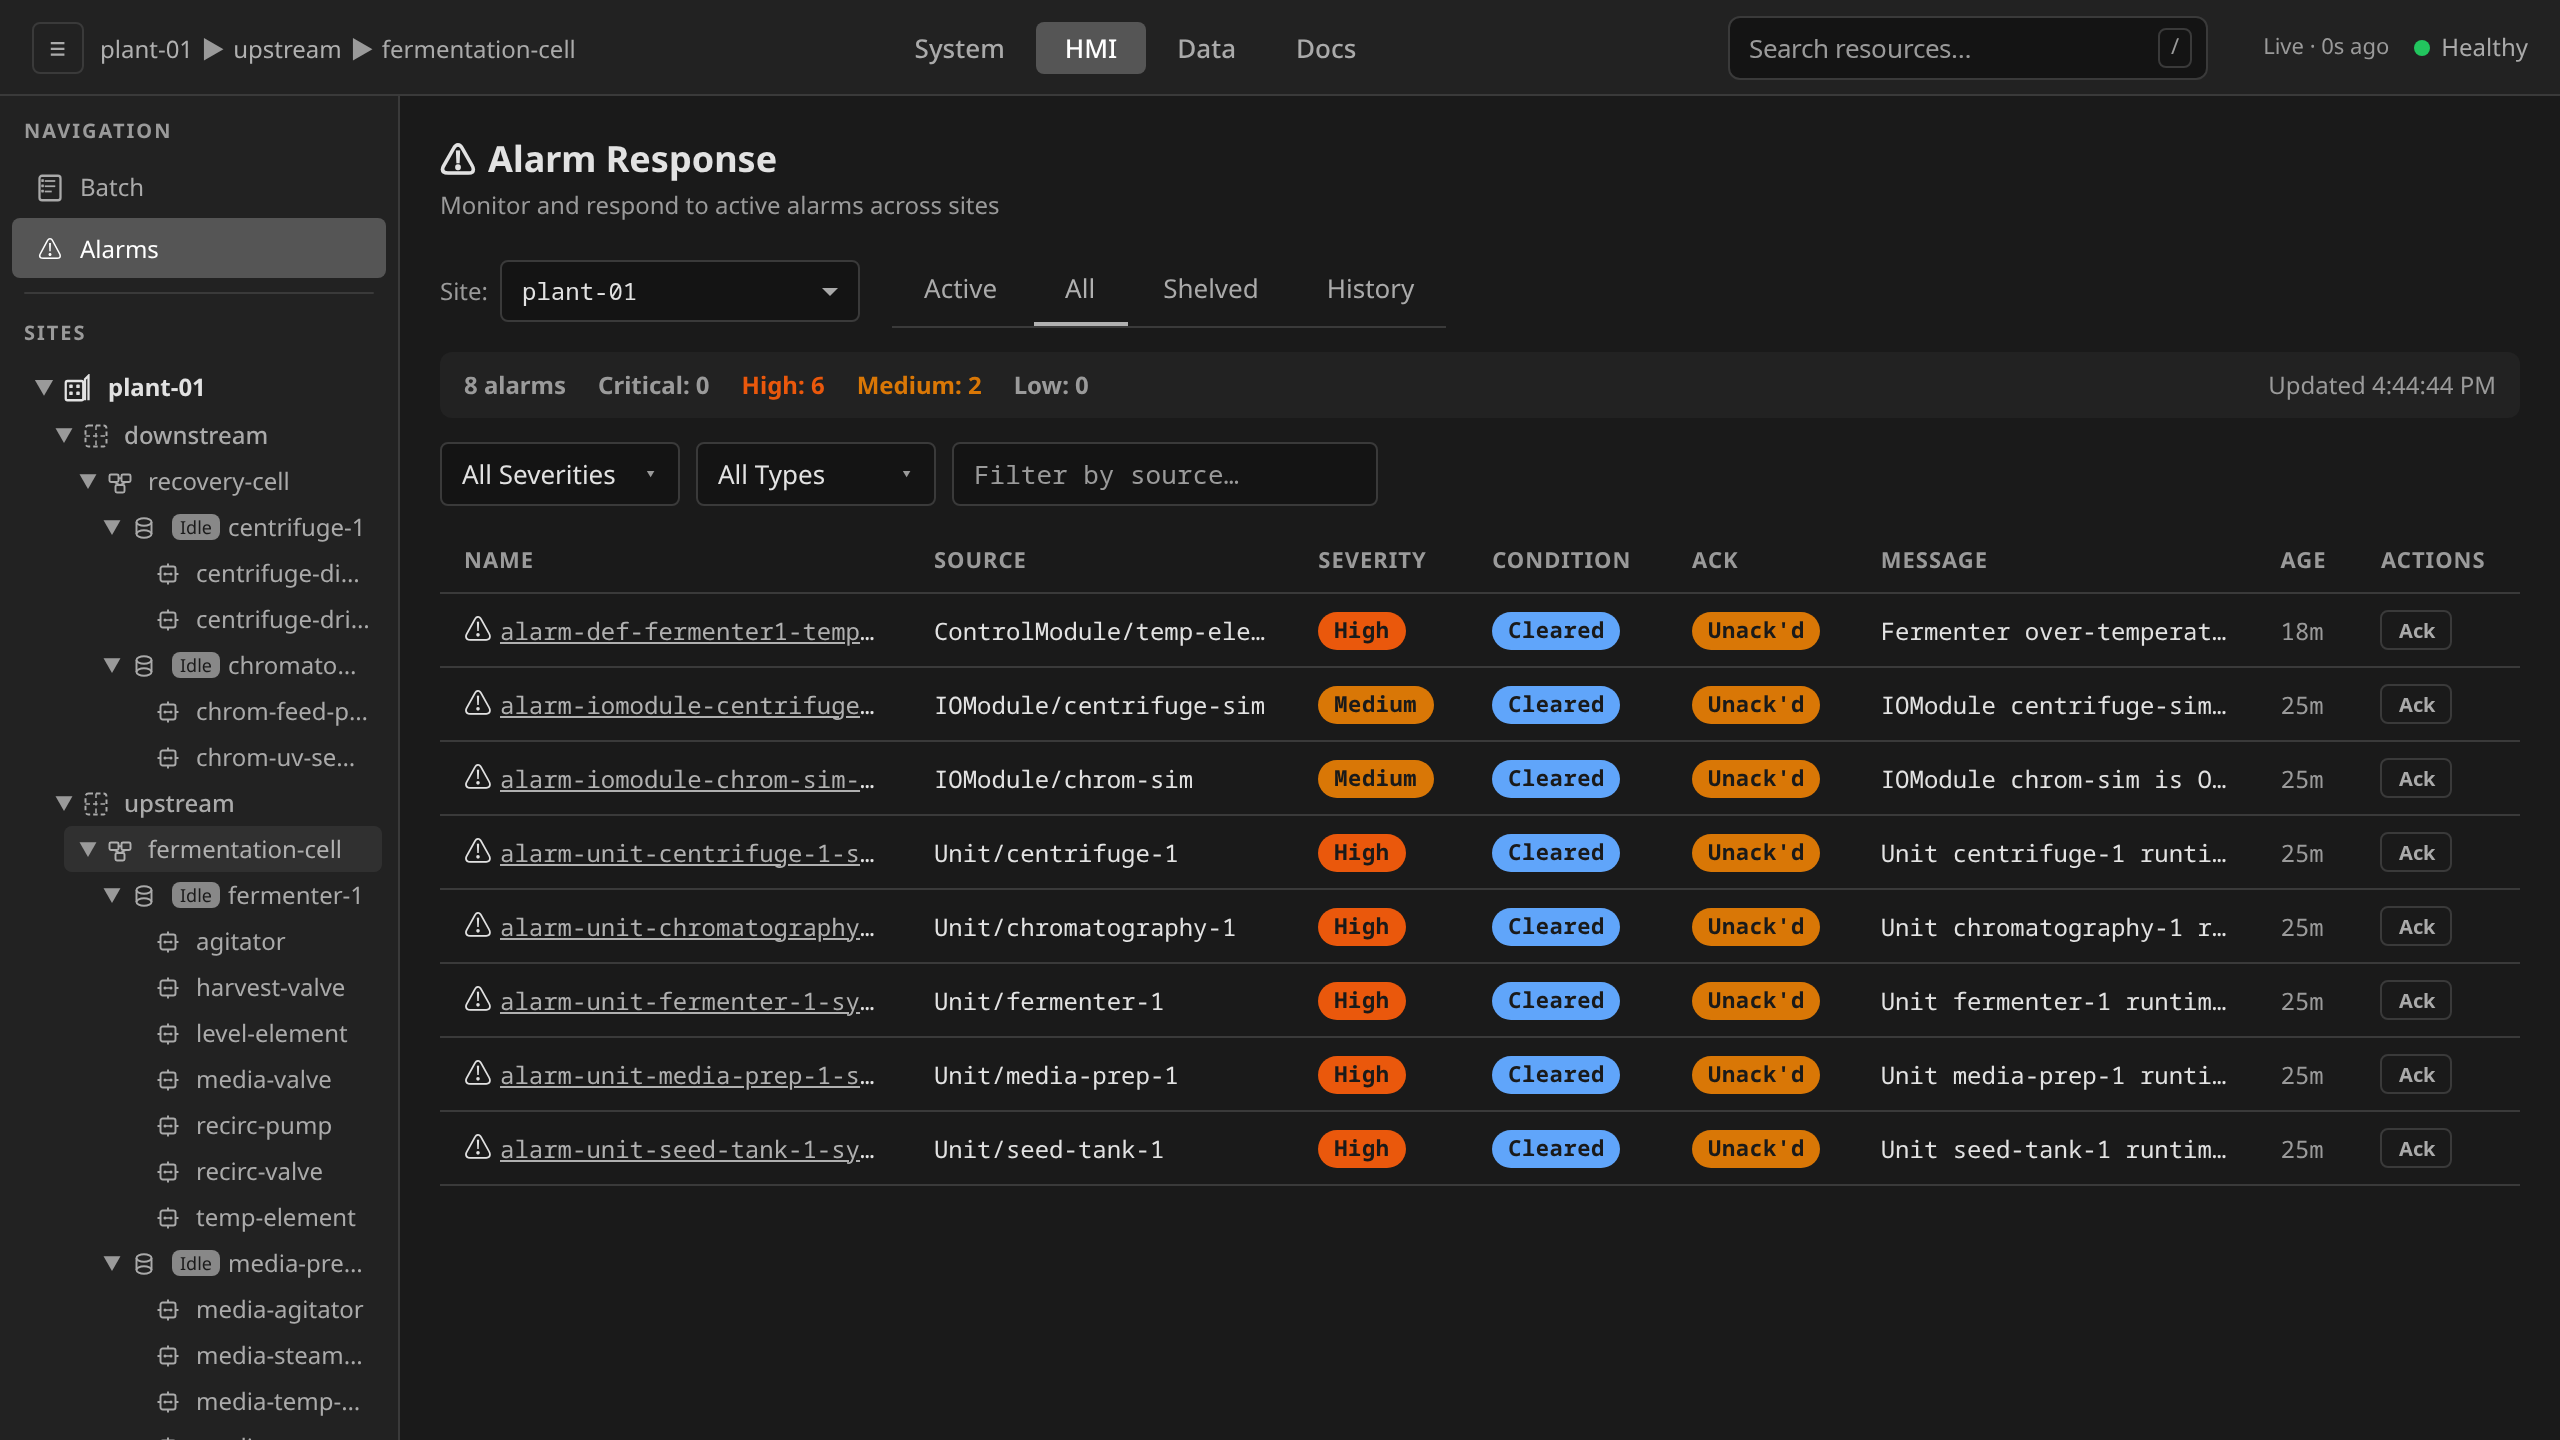
Shelved
Only alarms whose shelvedUntil is still in the future. Use this view
to audit what an operator has temporarily suppressed. Each row's action
is Unshelve (see Unshelve an alarm).
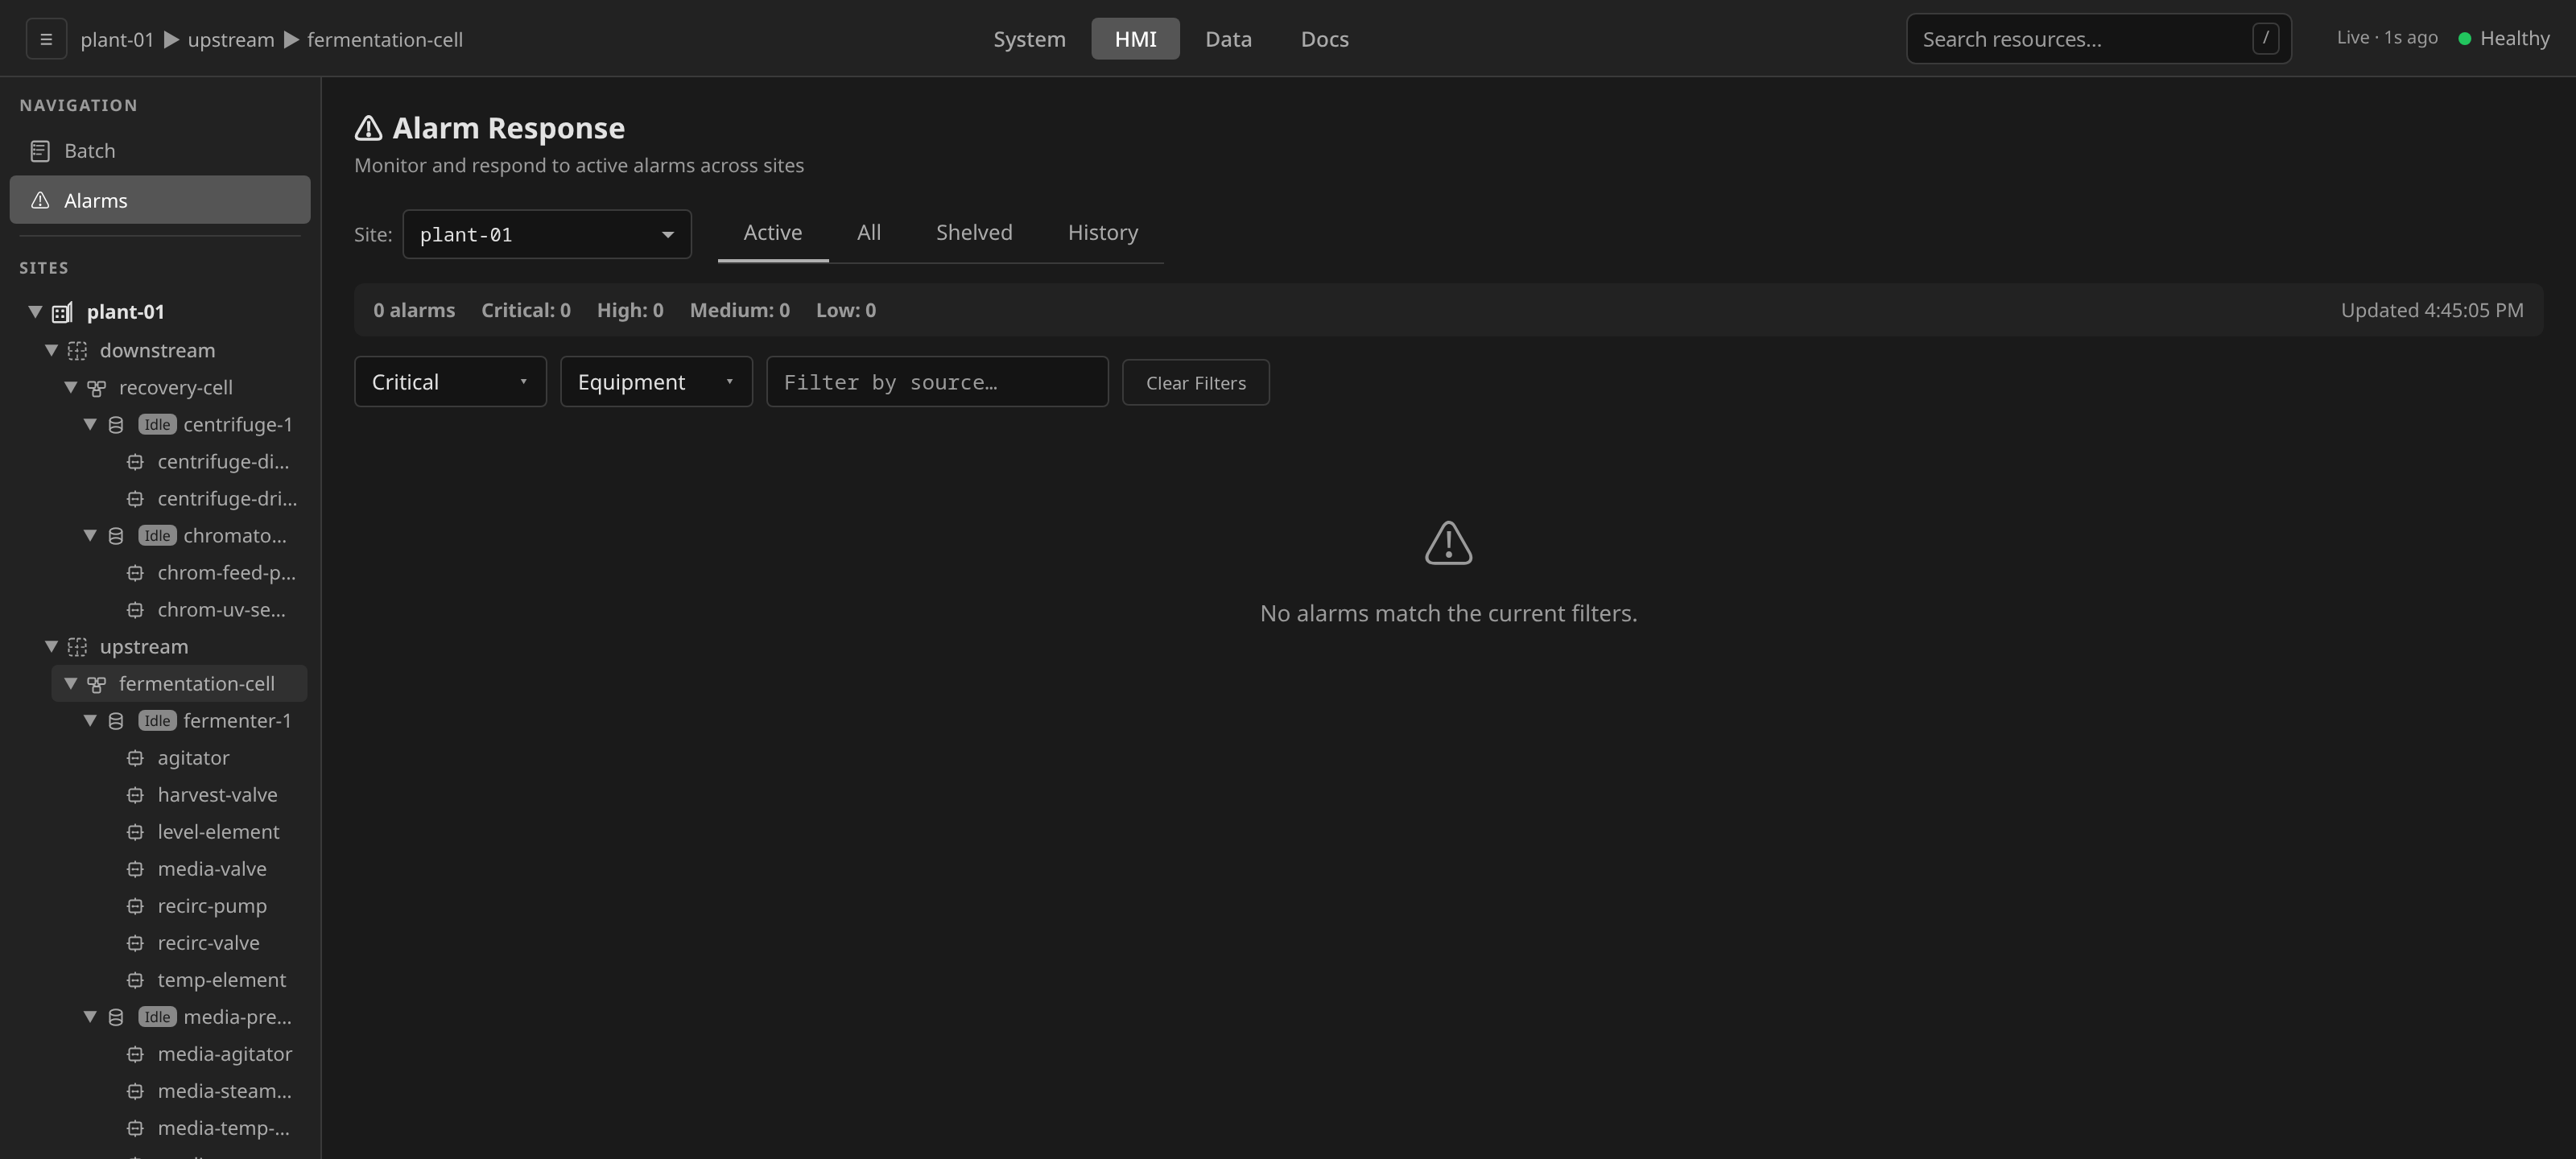
Filter the list
The filter row sits between the summary banner and the table. Filters combine. Selecting Severity = Critical and Type = Equipment narrows to rows matching both. Clear Filters appears once any filter is set.
- Severity drop-down:
Low,Medium,High,Critical. - Type drop-down:
Equipment,System. - Source free-text input: a case-insensitive substring match
against the alarm's source. It matches the source kind, the
source name, or the
kind/namethe Source column shows. Typinggranulatormatchesgranulator-plcandgranulator-bowl. TypingIOModulematches every alarm raised on an I/O module.
Filters map directly to query parameters on the list endpoint:
GET /api/v1/sites/{site}/alarms?severity=Critical&type=Equipment&source=granulator
Add &state=ActiveUnacknowledged to filter on the ISA-18.2 state
(the UI does this client-side when you switch sub-tabs). Permission:
PermRead.
source and state are filters the apiserver cannot answer, so
the gateway answers them itself. The gateway reads as many pages as it takes to fill
limit matching alarms. A response can therefore carry more than
limit items, because the page the count was filled on is kept
whole and metadata.continue names the page after it. A filter
that matches almost nothing gives up after 20 pages and hands back
the token of the page it stopped on.
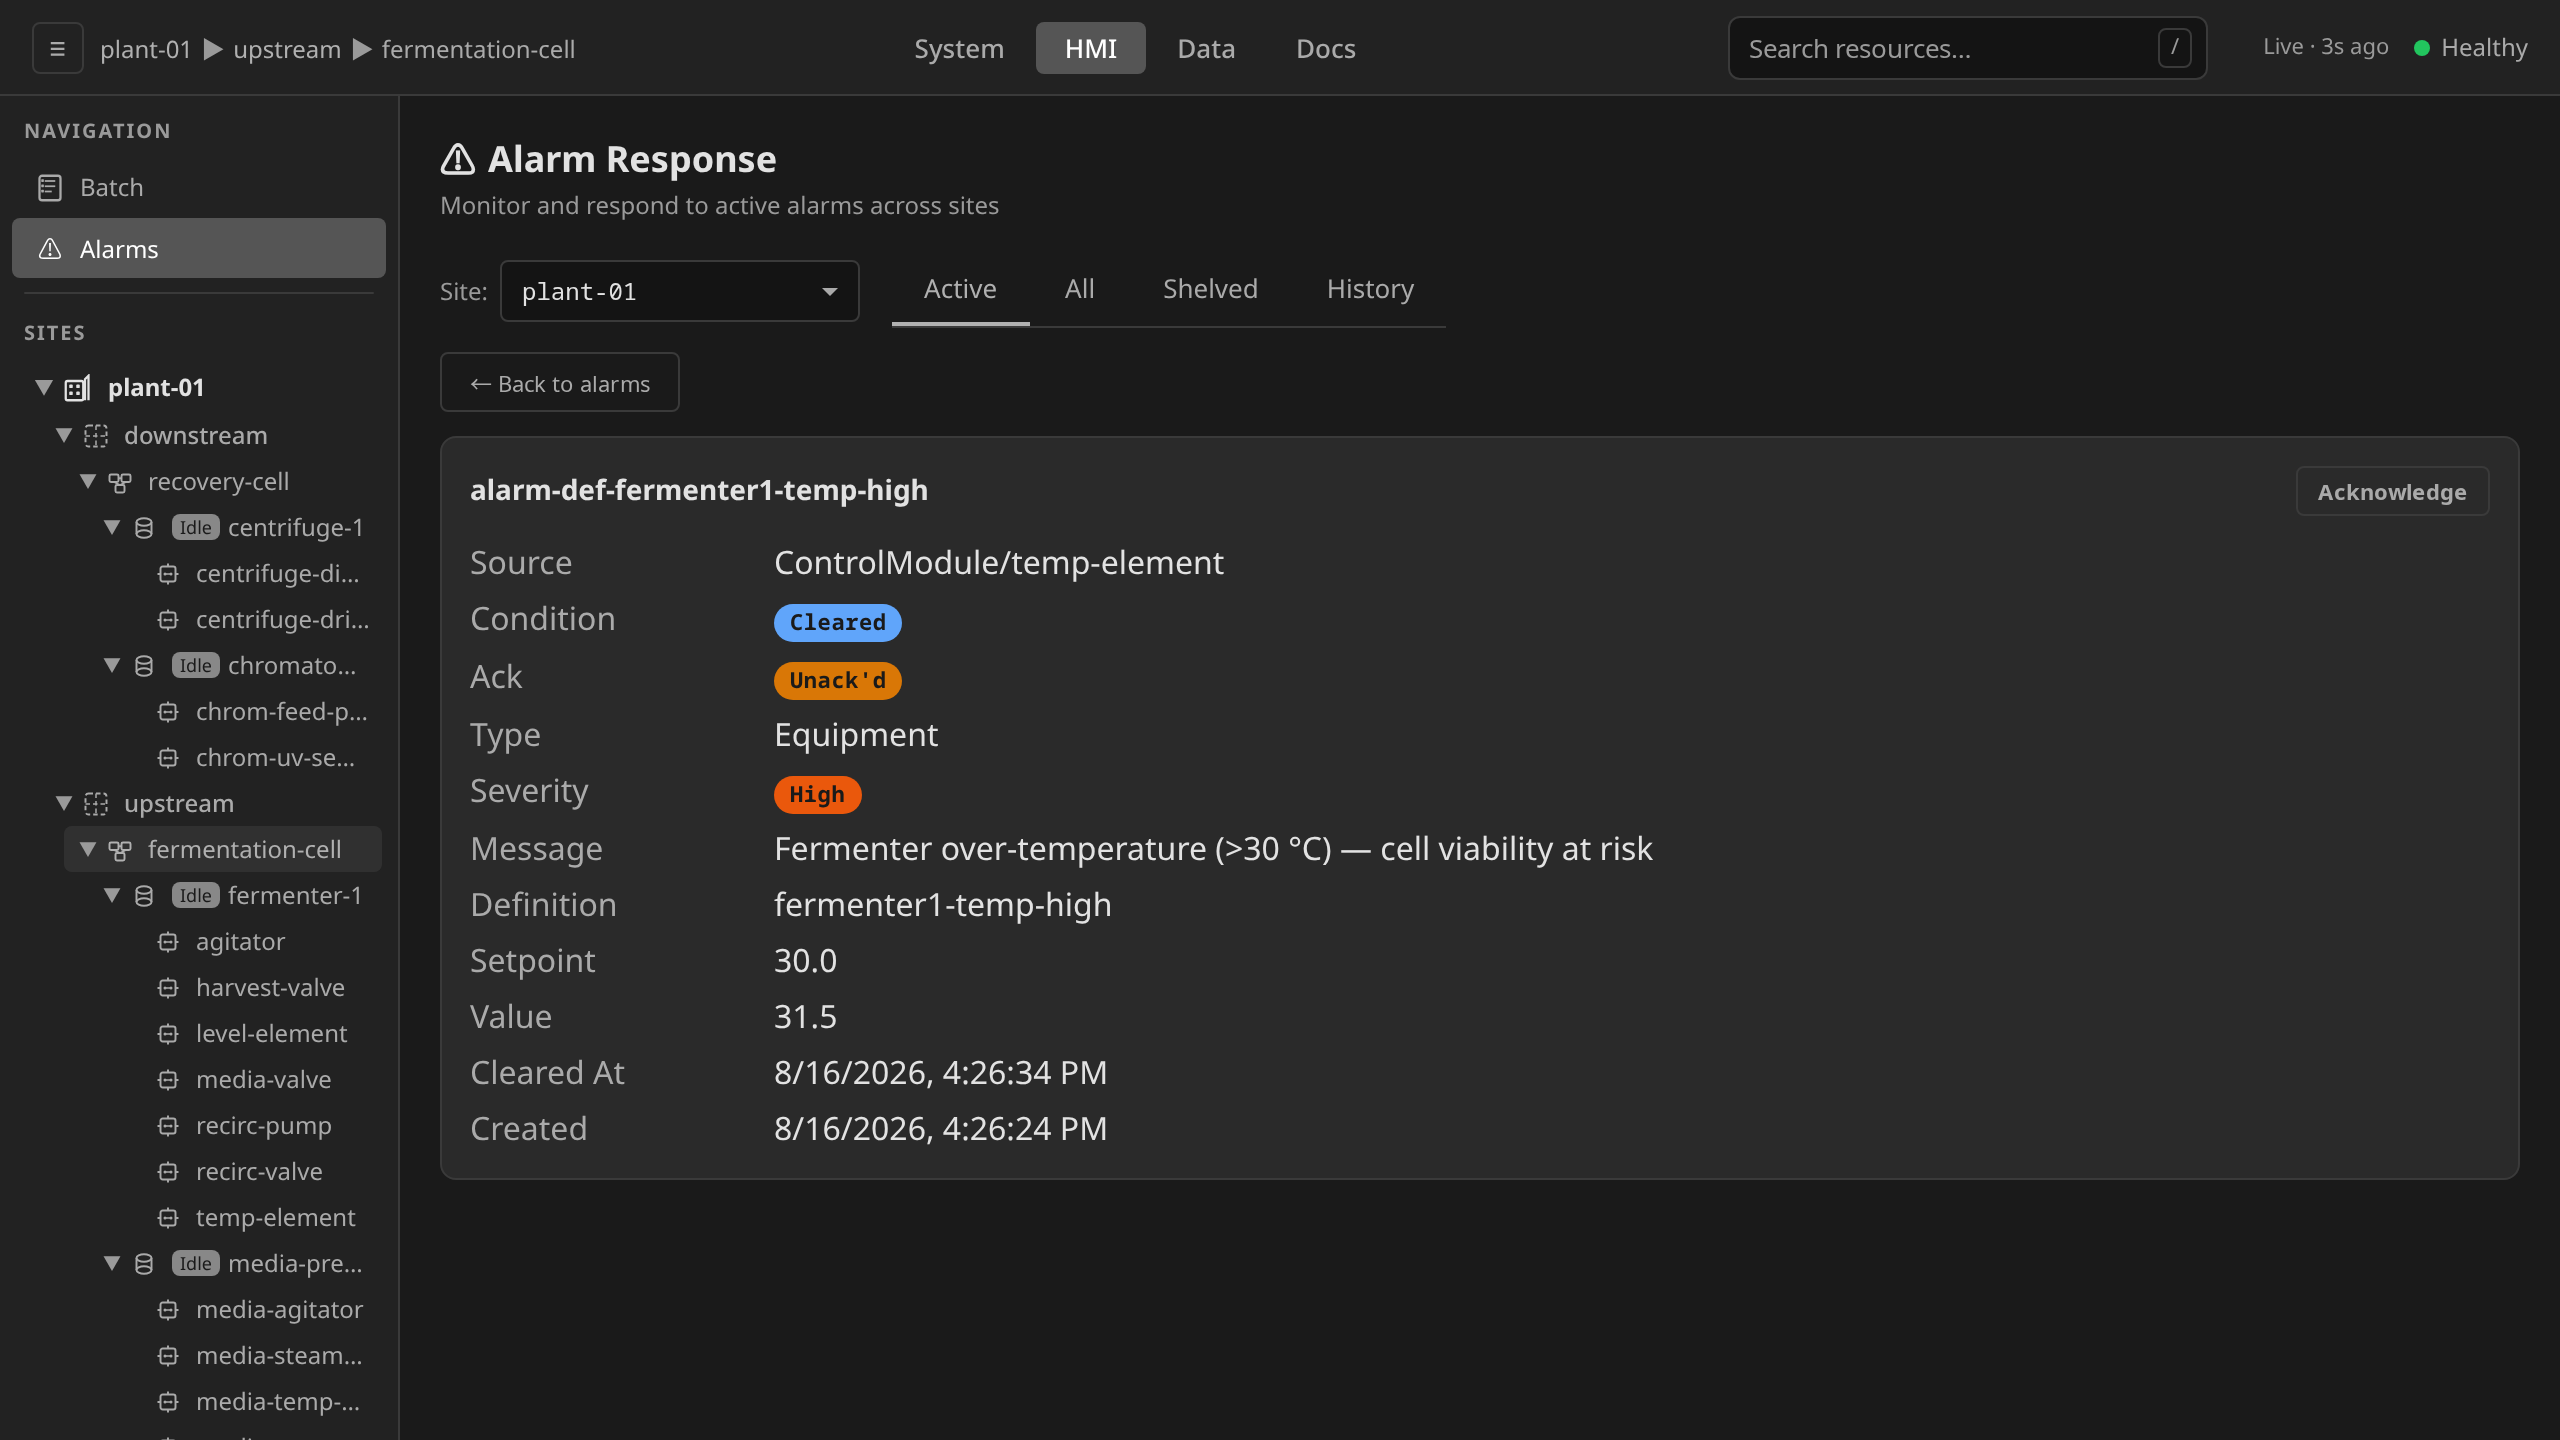
View alarm detail
Click any alarm name in the table. The detail panel replaces the list and shows source, condition, ack, type, severity, message, definition reference, setpoint, current value, and ack / cleared / shelved timestamps. ← Back to alarms returns to the list.
The detail panel header carries Acknowledge and Shelve buttons. Whether they're present depends on the alarm's current state (cleared+acknowledged alarms are read-only, and a shelved alarm offers Unshelve in Shelve's place).
GET /api/v1/sites/{site}/alarms/{name}
Returns the full Alarm DTO (same shape as the list elements).
Permission: PermRead.
Acknowledge an alarm
Acknowledging records acknowledgedBy and acknowledgedAt on the
alarm and transitions its state. ActiveUnacknowledged
becomes ActiveAcknowledged, and ClearedUnacknowledged becomes
ClearedAcknowledged. It does not clear the underlying
condition. It only attests that an operator has seen it. The gateway
writes a dcs.io/command=Acknowledge annotation. The alarm
controller picks that up, updates status, and clears the annotation.
Permission: PermOperate.
The UI offers three places to acknowledge. They all hit the same endpoint and produce the same audit records. Pick whichever is closest to where you noticed the alarm.
One acknowledgement writes two audit records, and they say different
things. The gateway writes the dispatch: Command / Accepted, naming
the operator by account id and display name. The alarm controller writes
the verdict once it has read the annotation: Command / Success
carrying the state change, or Command / Rejected when the alarm was
already acknowledged by the time the controller got there. The verdict
record names the controller. The person who asked is on the dispatch
record. Filter the Audit Trail on the account id to find every
acknowledgement an operator made.
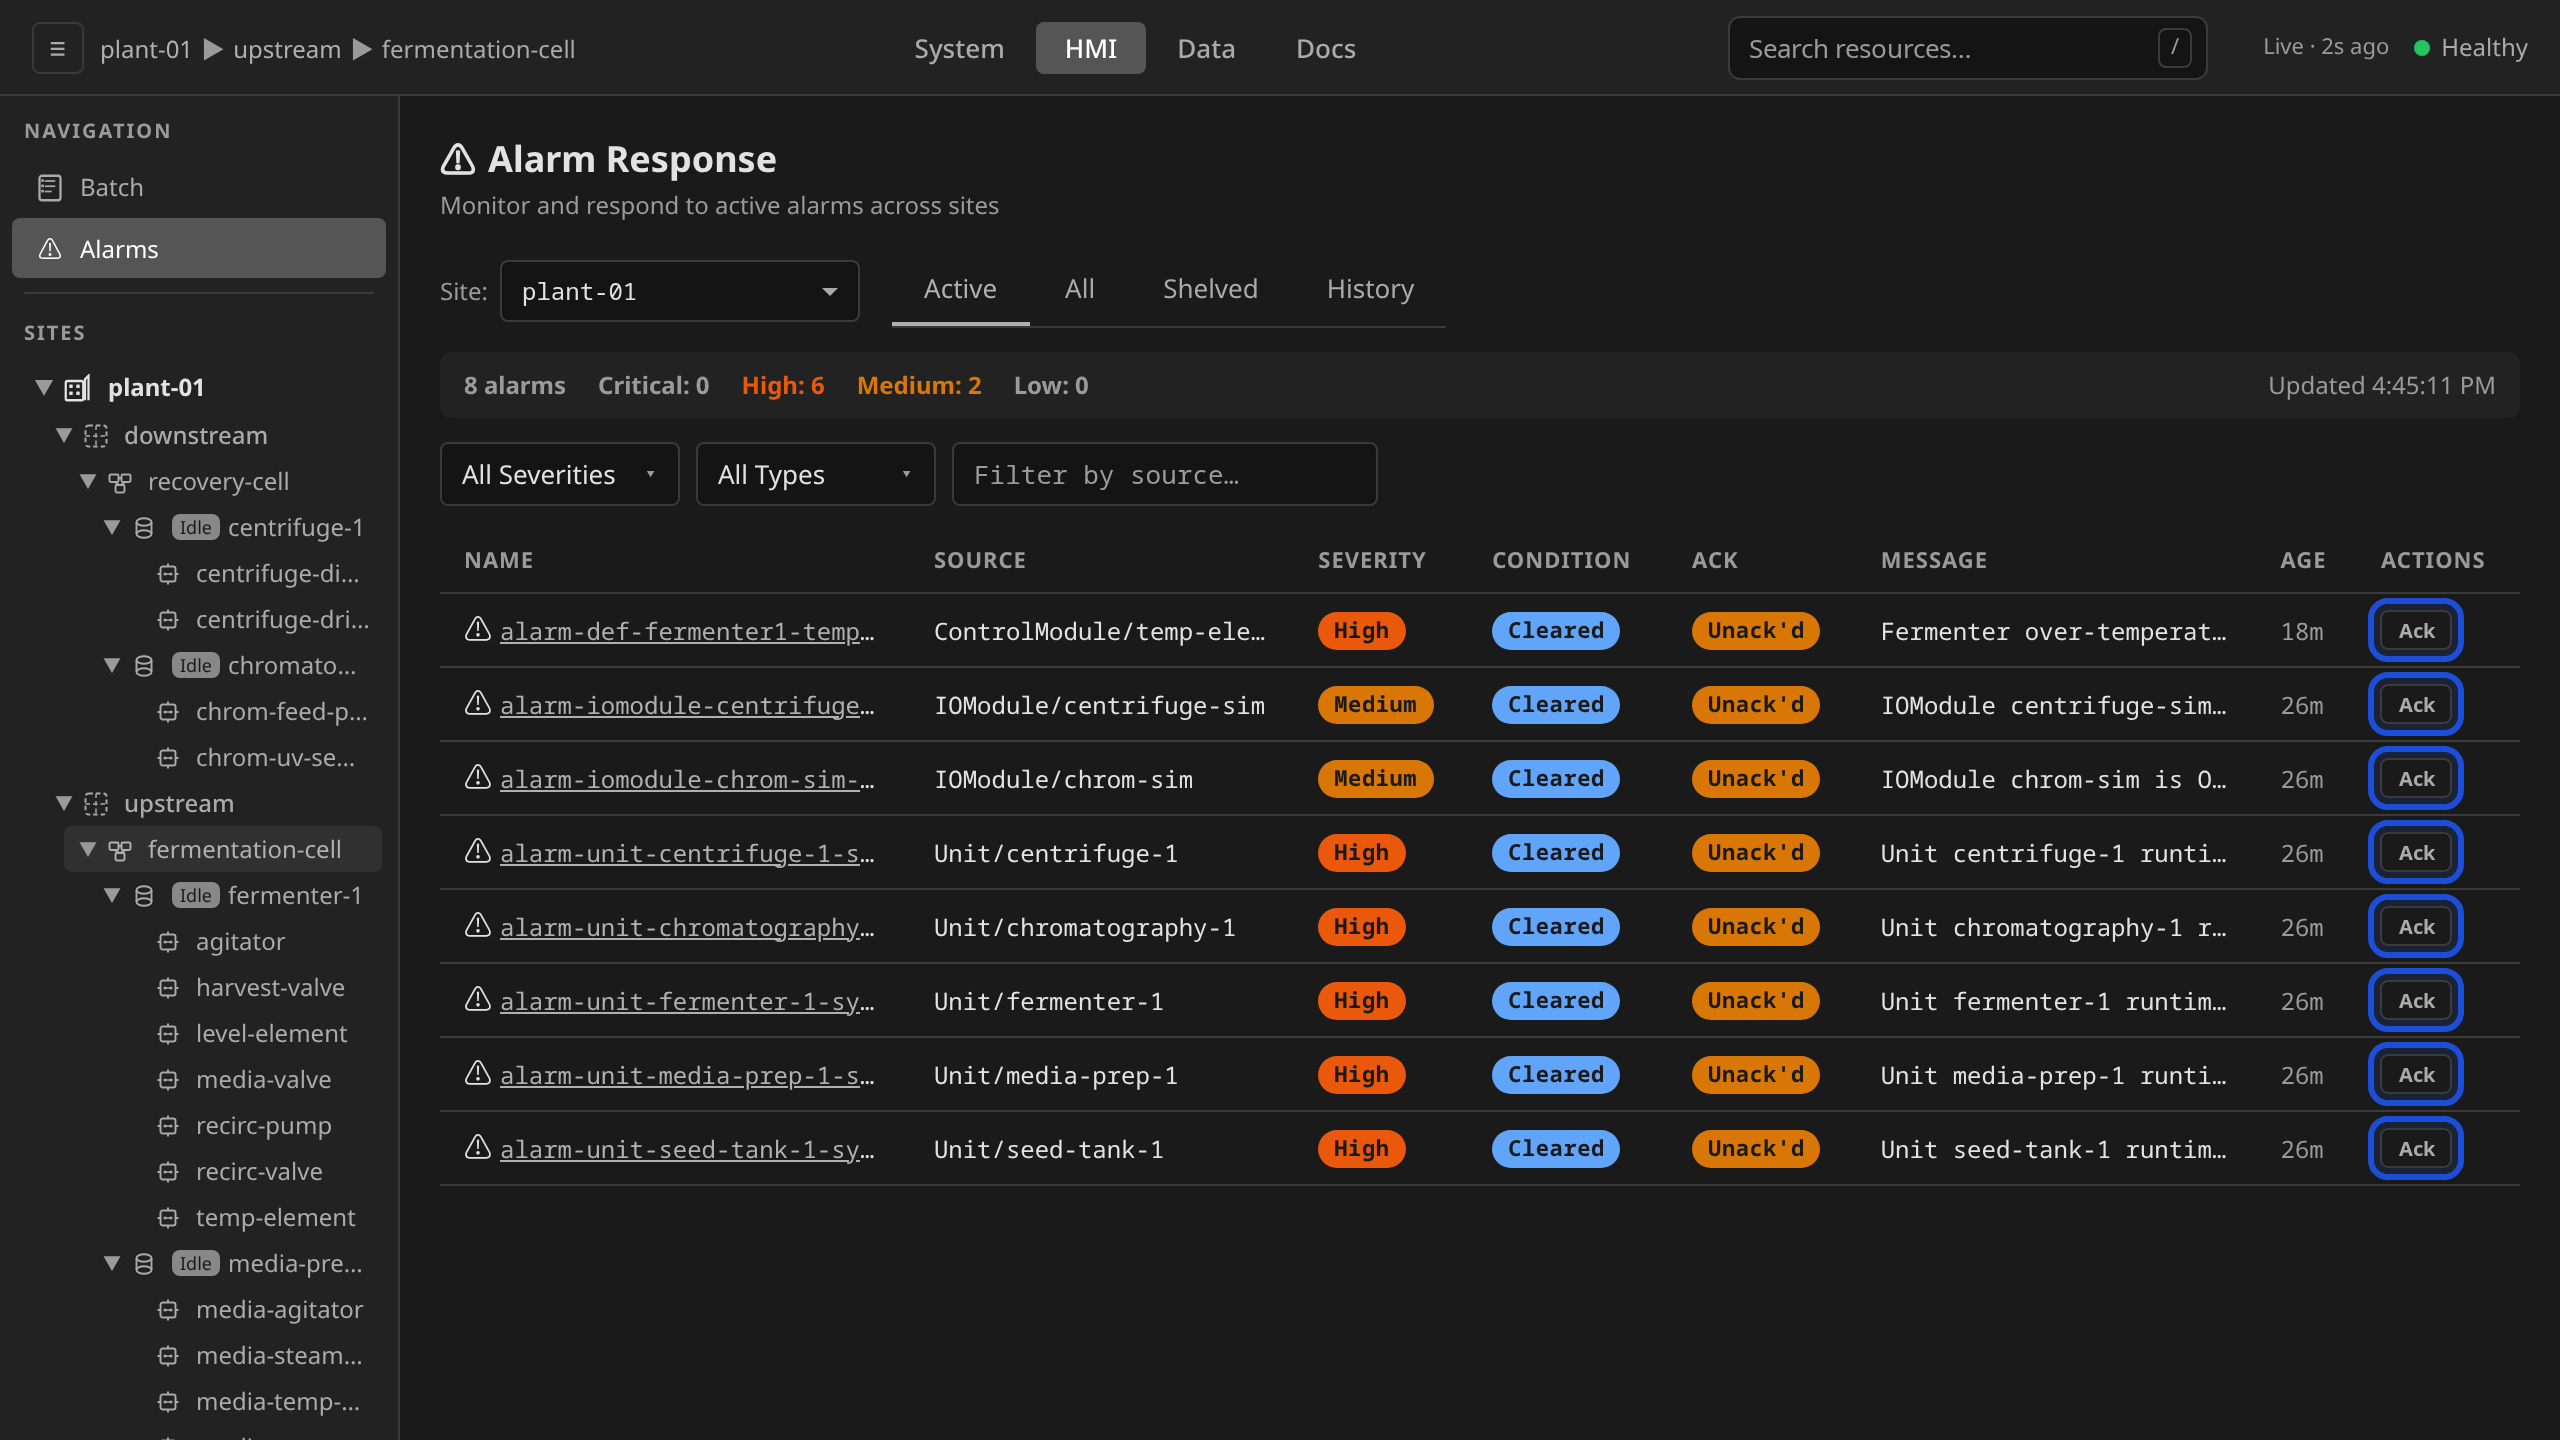
From the alarm row
The Alarms list carries an inline Ack button in the Actions
column for every row whose state is ActiveUnacknowledged or
ClearedUnacknowledged. Use this when triaging multiple alarms in
sequence: you stay on the list and the next row is one click away.
dcs --site newark-plant alarm ack granulator-1-bowl-overpressure
From the alarm detail panel
Click an alarm name in the list to open the detail panel, then hit Acknowledge in the panel header. The panel also shows the source, severity, message, setpoint, current value, and any existing ack/cleared/shelved timestamps. That context is often what you want in view before signing off.
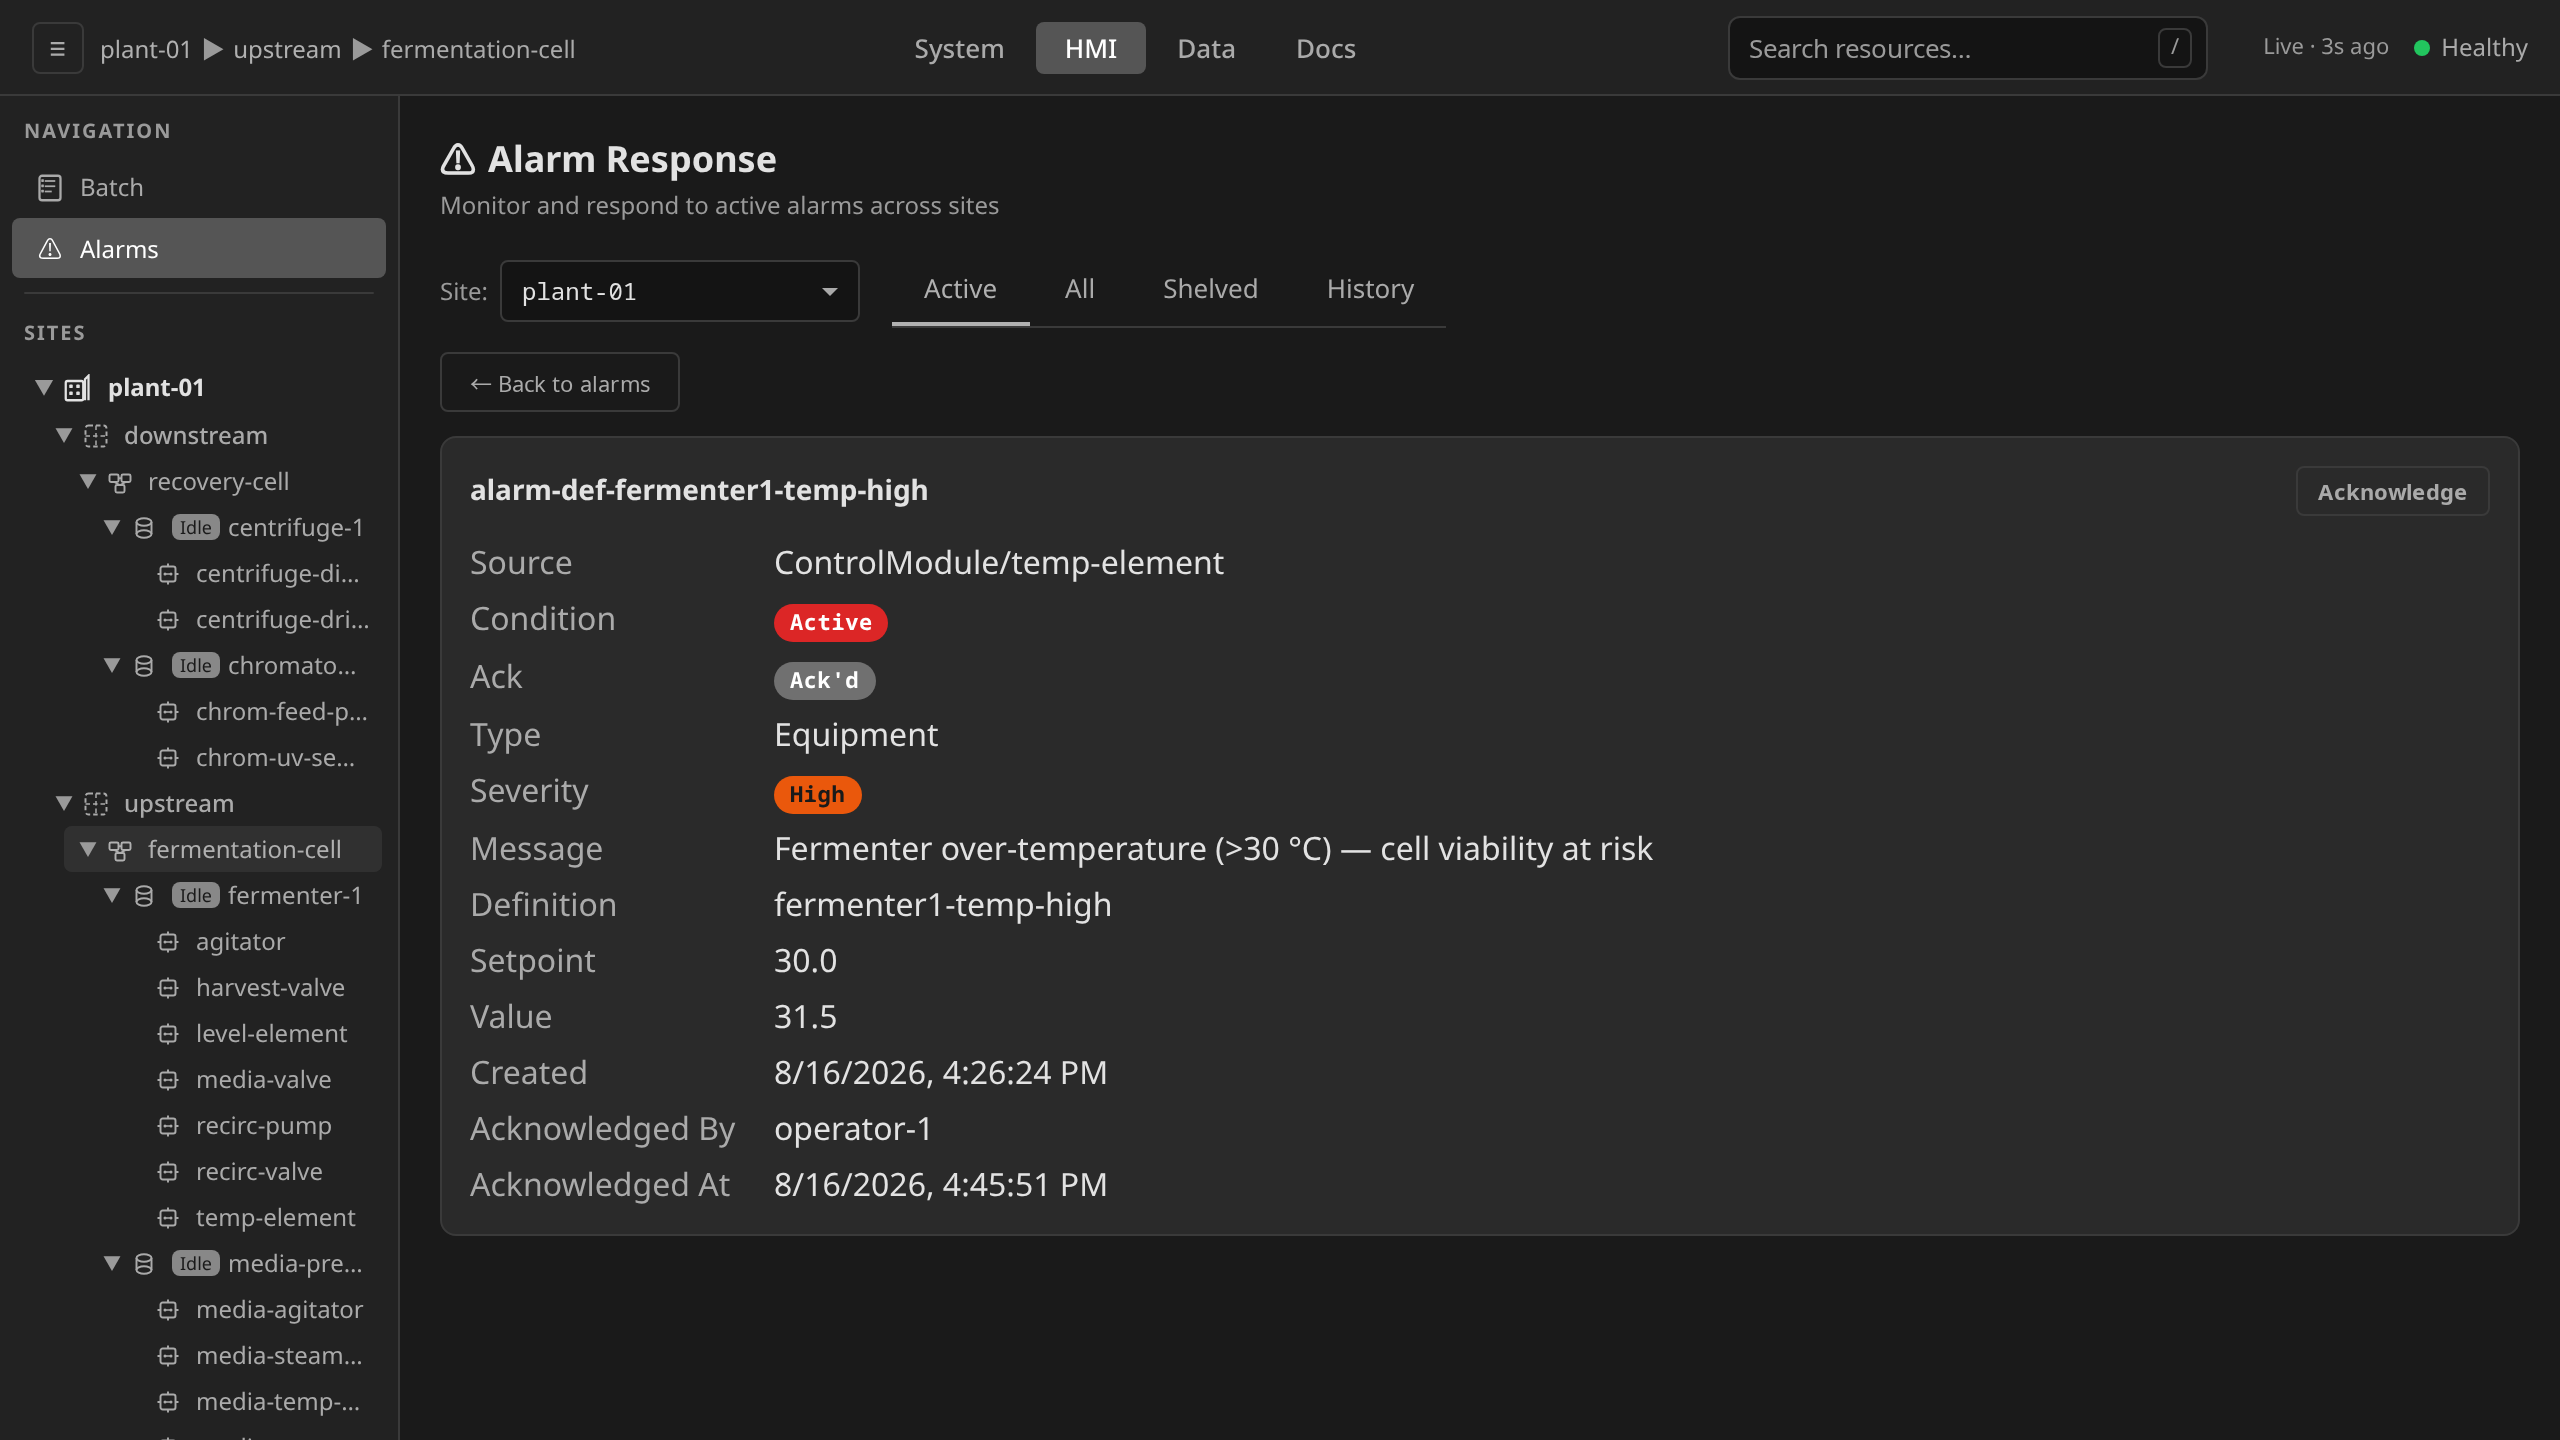
What acknowledging does depends on the alarm's condition, and the detail panel is the clearest place to see the contrast. The walkthrough below acknowledges two alarms in turn, one whose condition has returned to normal and one still active:
/hmi → Alarms from each alarm's detail panel.
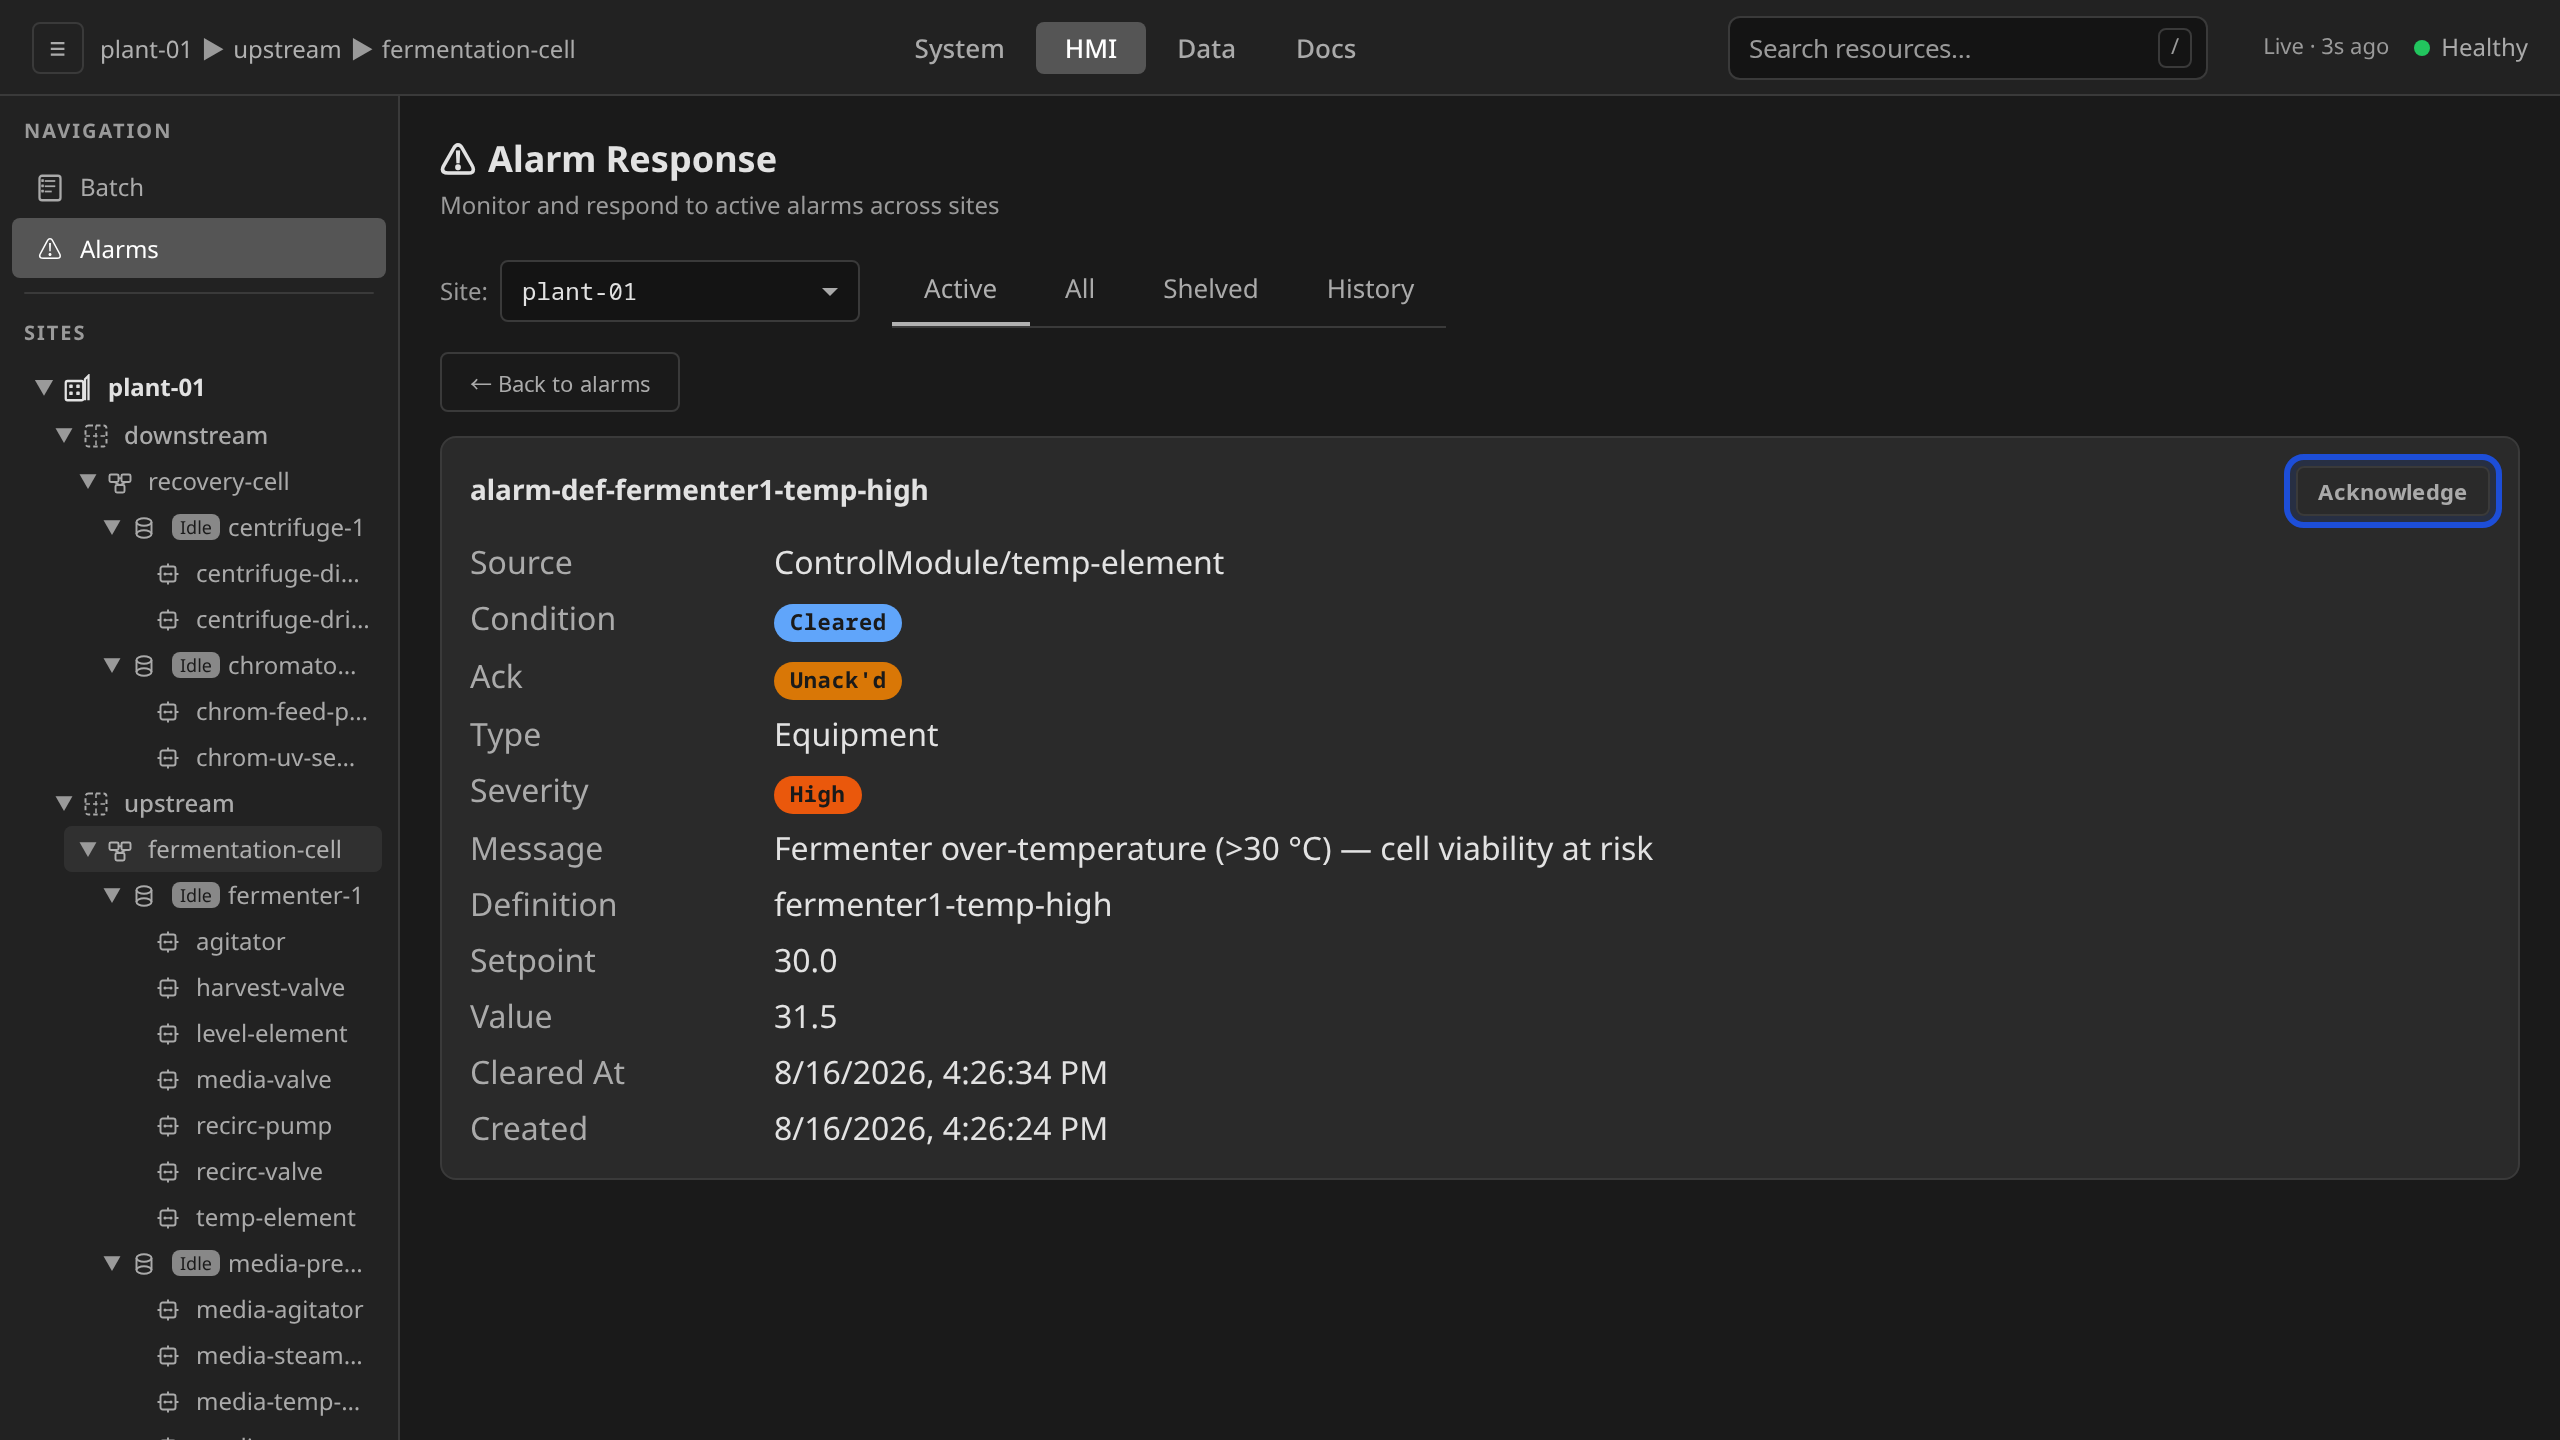
When the condition has already returned to normal
(ClearedUnacknowledged), acknowledging is the last step the alarm
needs. It becomes ClearedAcknowledged (green Cleared /
gray Resolved, no remaining actions) and leaves the
Active working set.
When the condition is still present (ActiveUnacknowledged), the
panel re-renders without the Acknowledge button, the Ack badge flips
to gray Ack'd, and new Acknowledged By + Acknowledged At
rows appear. The Condition badge stays red Active,
because the underlying signal hasn't cleared. Acknowledging silences
the annunciation. To suppress the still-present condition you
shelve it.
Acknowledging is performed by setting an annotation on the existing Alarm. You don't apply a fresh manifest. The gateway and CLI use this same path internally:
kubectl annotate alarm -n site-newark-plant \
  granulator-1-bowl-overpressure \
  dcs.io/command=Acknowledge --overwrite
From the faceplate alarm strip
When a faceplate is open for a control module that has an unacknowledged alarm, an inline Unacknowledged Alarm strip appears at the top of the panel listing every active alarm on that module. Each strip row carries its own Ack button plus a View in Alarms link to jump to the global view. Use this when you're already focused on configuring or interlocking that module and don't want to break flow.
On the unit dashboard, each collapsed equip card whose control module has an unacknowledged active alarm carries its own amber border, so you can pick the alarming card out of the grid without expanding each one or switching to the canvas view. Click the amber-bordered card to expand its faceplate and see the strip.

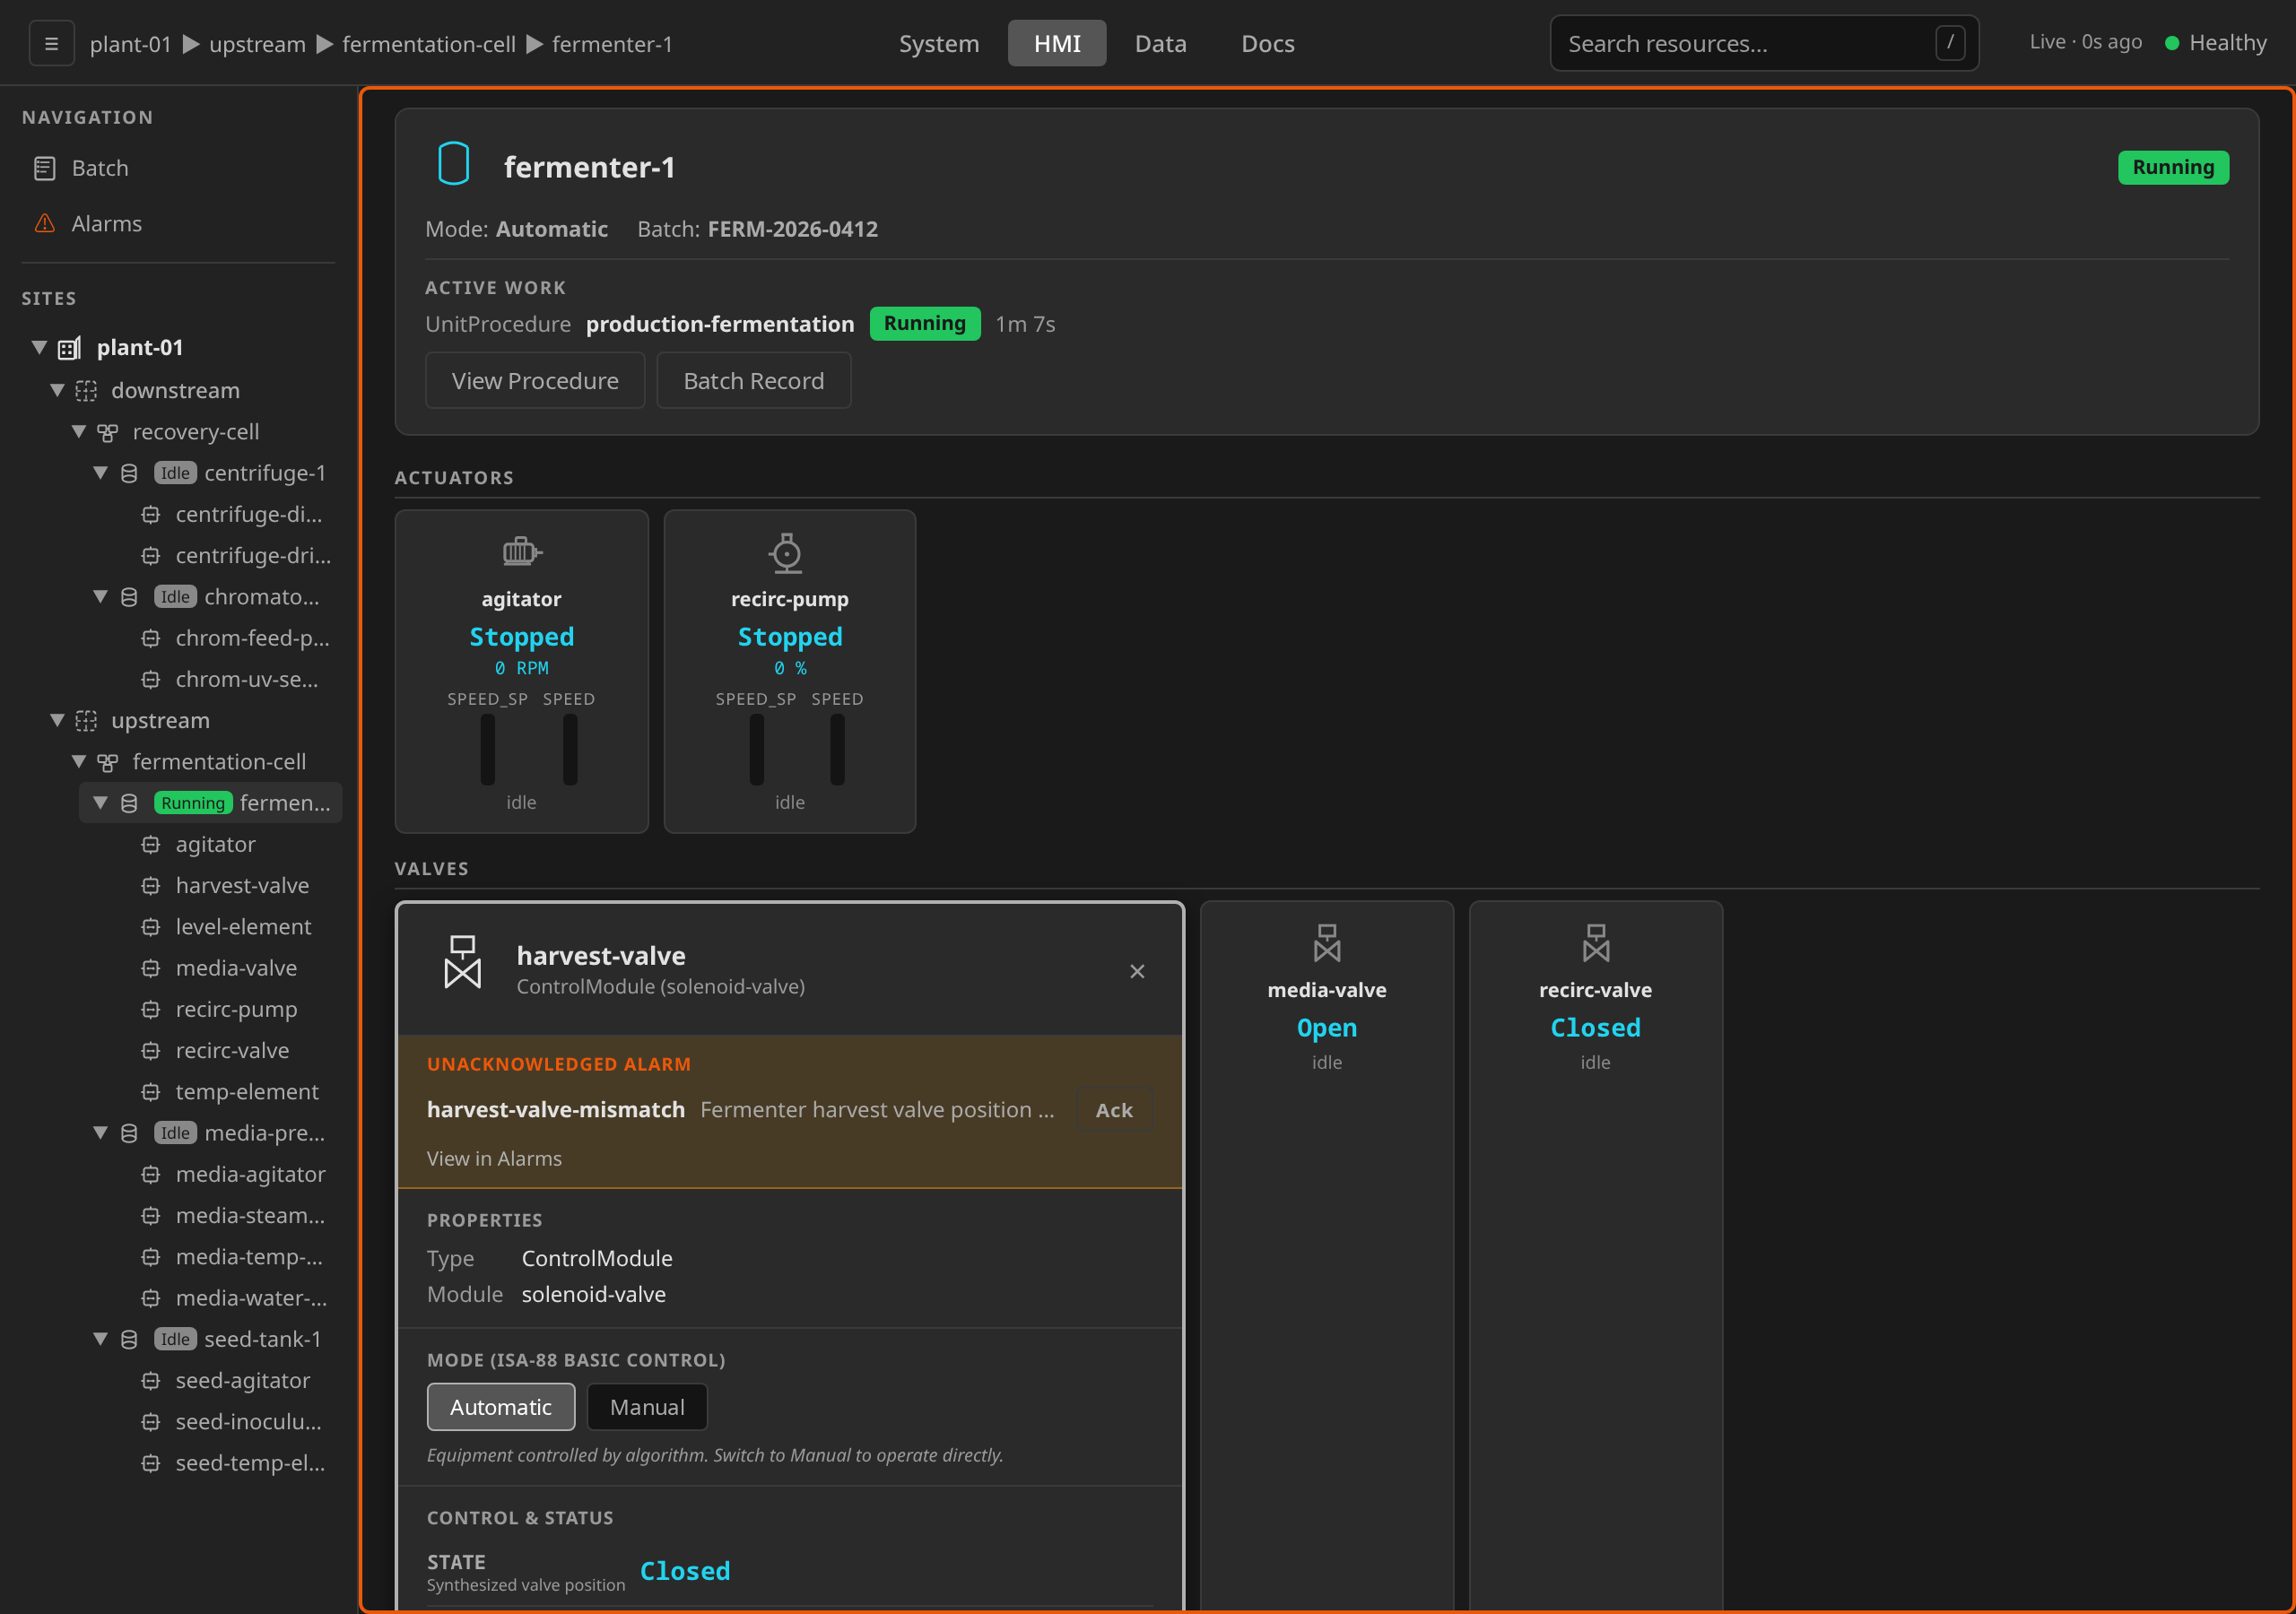
The amber faceplate border clears the instant the alarm is acknowledged from anywhere (this strip, the alarm row, the detail panel, the CLI, or a direct API call), even if the underlying condition is still active. Shelving from this surface is not supported. Use the alarm row or detail panel for that.
Shelve an alarm
Shelving temporarily suppresses annunciation of a noisy alarm for a chosen
duration, useful during planned maintenance or when a fault is a known
side-effect of another operation. It is the ISA-18.2 operator-grade suppression:
temporary, time-limited, audited, and auto-returning, distinct from out-of-service
(spec.enabled, engineering) and state-based suppression (armingGate).
Suppression is system-wide. The shelve rides the retained alarm event
(shelved / shelvedUntil). Every annunciation consumer goes quiet for the
duration: the HMI indicators (nav icon, unit-card border, faceplate strip) and
any external annunciator/SCADA/notifier (ADR 0014). The alarm itself is not
cleared. It stays in the list (visible under
All and Shelved, hidden under Active). Once shelvedUntil
passes, the controller auto-unshelves, and annunciation resumes if the condition
is still active. An operator can also
unshelve at any time to end the suppression early.
You must acknowledge an alarm before you can shelve it. Shelving is offered
only for ActiveAcknowledged alarms. You cannot suppress an alarm nobody has
registered as seen, and you cannot pre-shelve a cleared/idle one (the API
rejects other states with 409 Conflict). Acknowledge and shelve stay two
distinct, separately-audited operator decisions. Permission: PermOperate.
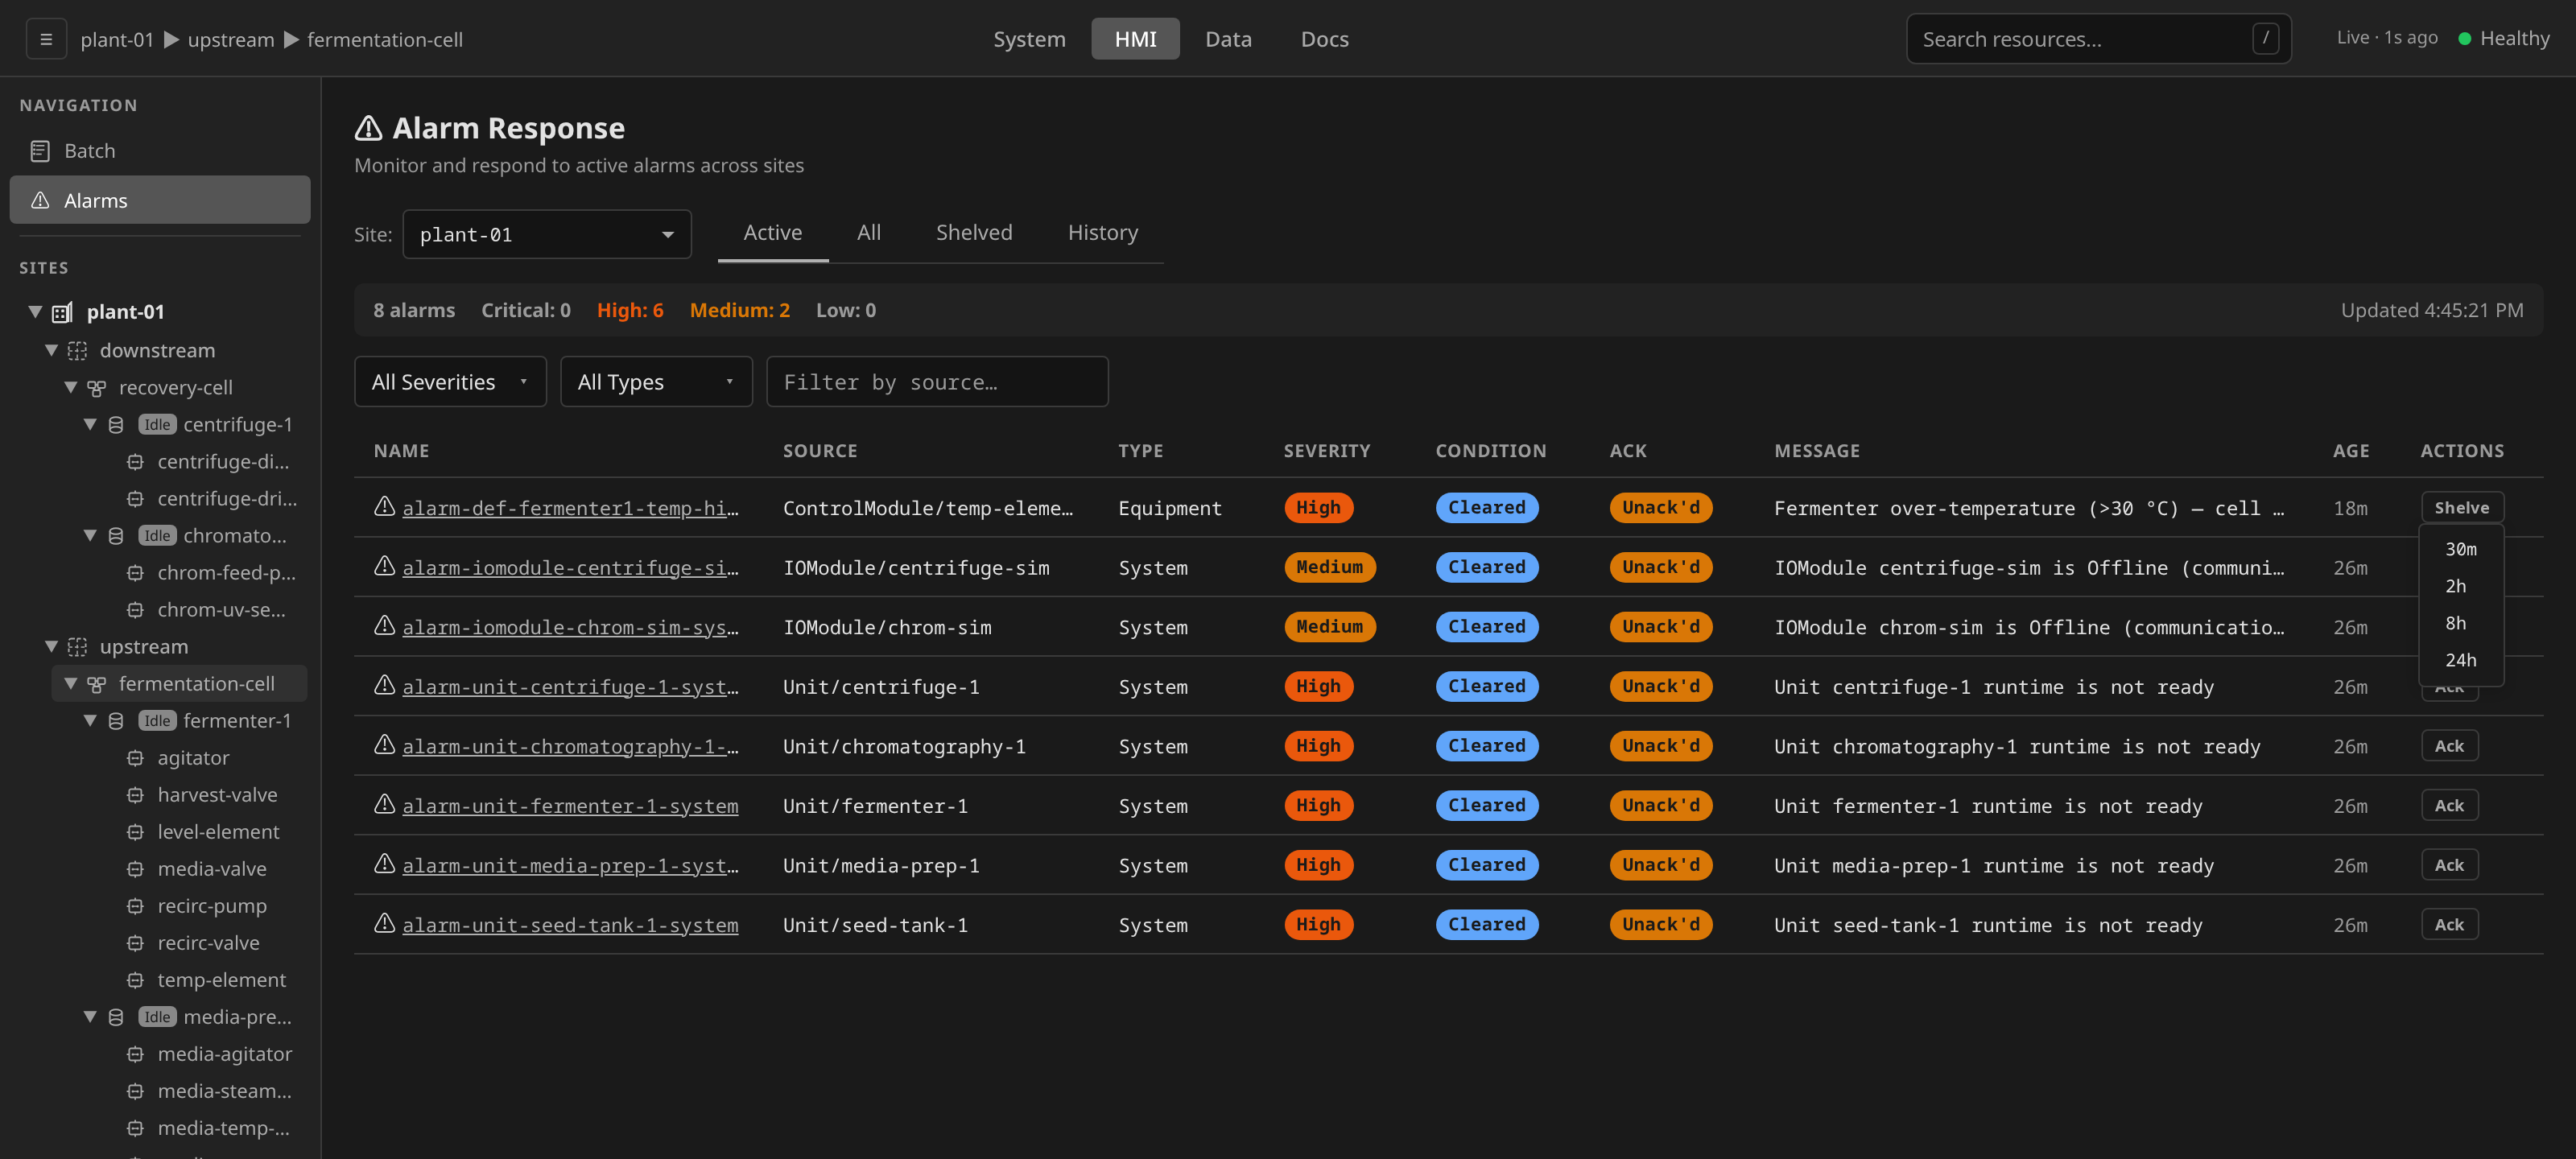
Acknowledge the alarm first. The Shelve control then appears. From a
row, click Shelve to open a duration menu with quick presets (30m,
2h, 8h, 24h). From the detail panel, Shelve expands a duration
field under the alarm header, pre-filled 2h and accepting any Go-style
duration string (45m, 1h30m, 7d, …). The alarm stays on screen
behind it, so the condition and acknowledgement you are shelving against
are readable while you choose the window.
dcs --site newark-plant alarm shelve \
  granulator-1-bowl-overpressure --duration 2h
Unshelve an alarm
Shelving always has an explicit return path (ISA-18.2). The controller
auto-unshelves when shelvedUntil passes, and an operator can unshelve
at any time to end the suppression early, for example when the maintenance
that justified the shelve finishes ahead of schedule. Unshelving restores
annunciation immediately. The alarm returns to the Active sub-tab, and
every annunciation consumer lights back up if the condition is still
active. It is a separately-audited operator action, like acknowledge
and shelve. Permission: PermOperate. Unshelving an alarm that isn't shelved
is rejected with 409 Conflict.
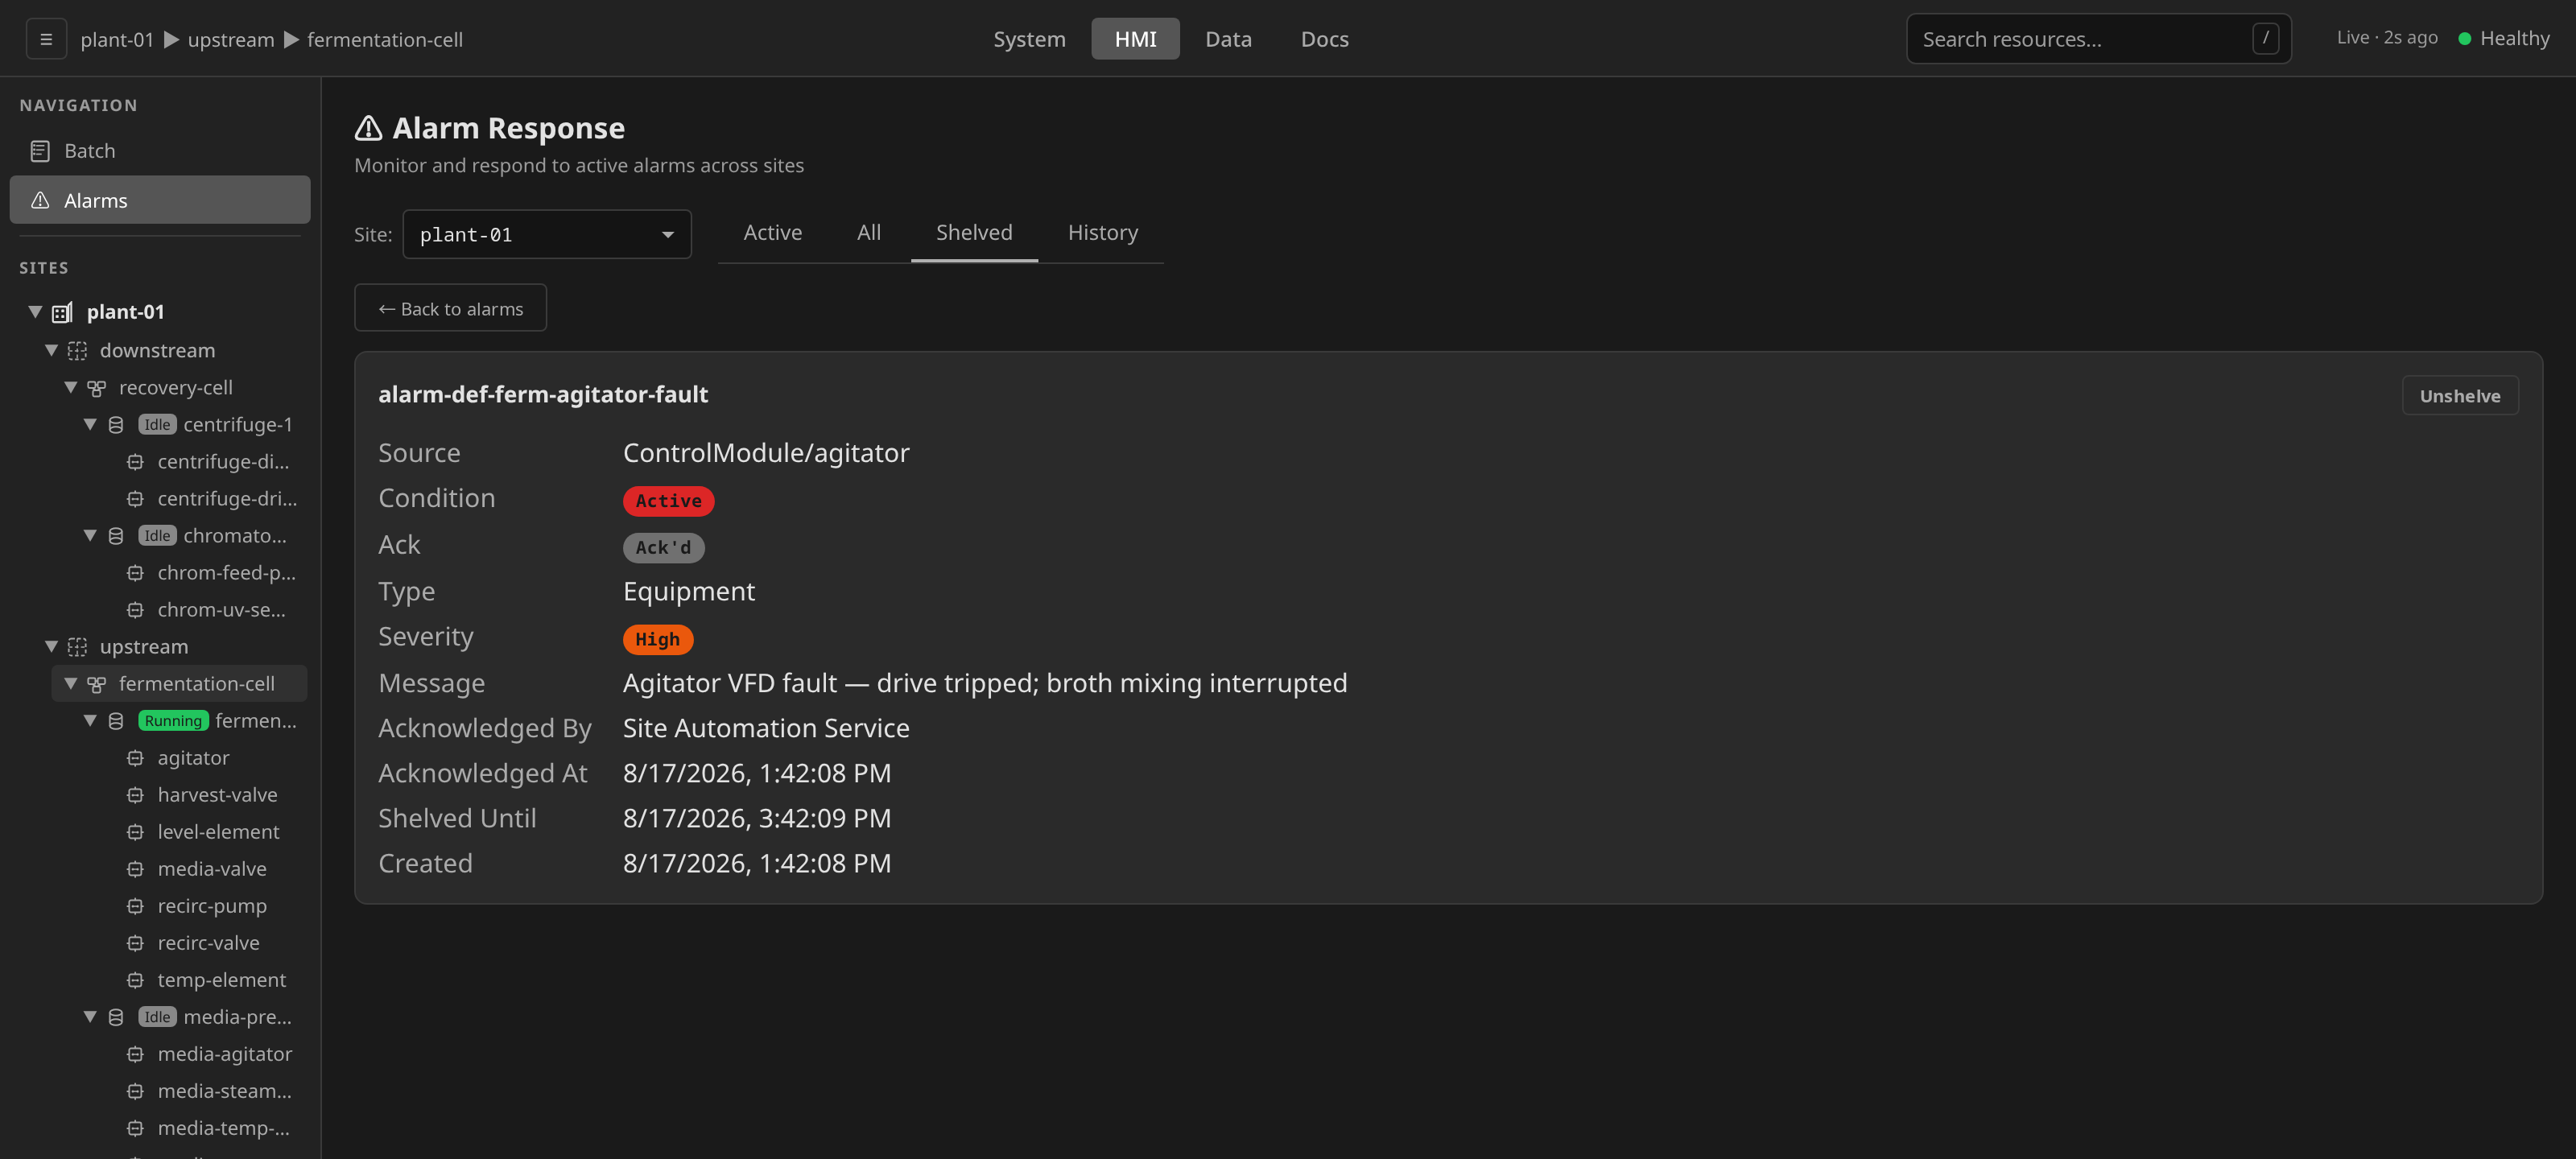
A shelved alarm never offers a second Shelve. Its row action (under All and Shelved) and its detail-panel action both become Unshelve for the life of the shelve window. To extend a window, unshelve and shelve again with the new duration.
Open the Shelved sub-tab and click Unshelve on the row, or open the alarm's detail panel. The panel shows the Shelved Until timestamp with Unshelve in its header.
dcs --site newark-plant alarm unshelve \
  granulator-1-bowl-overpressure
See alarms in the process cell
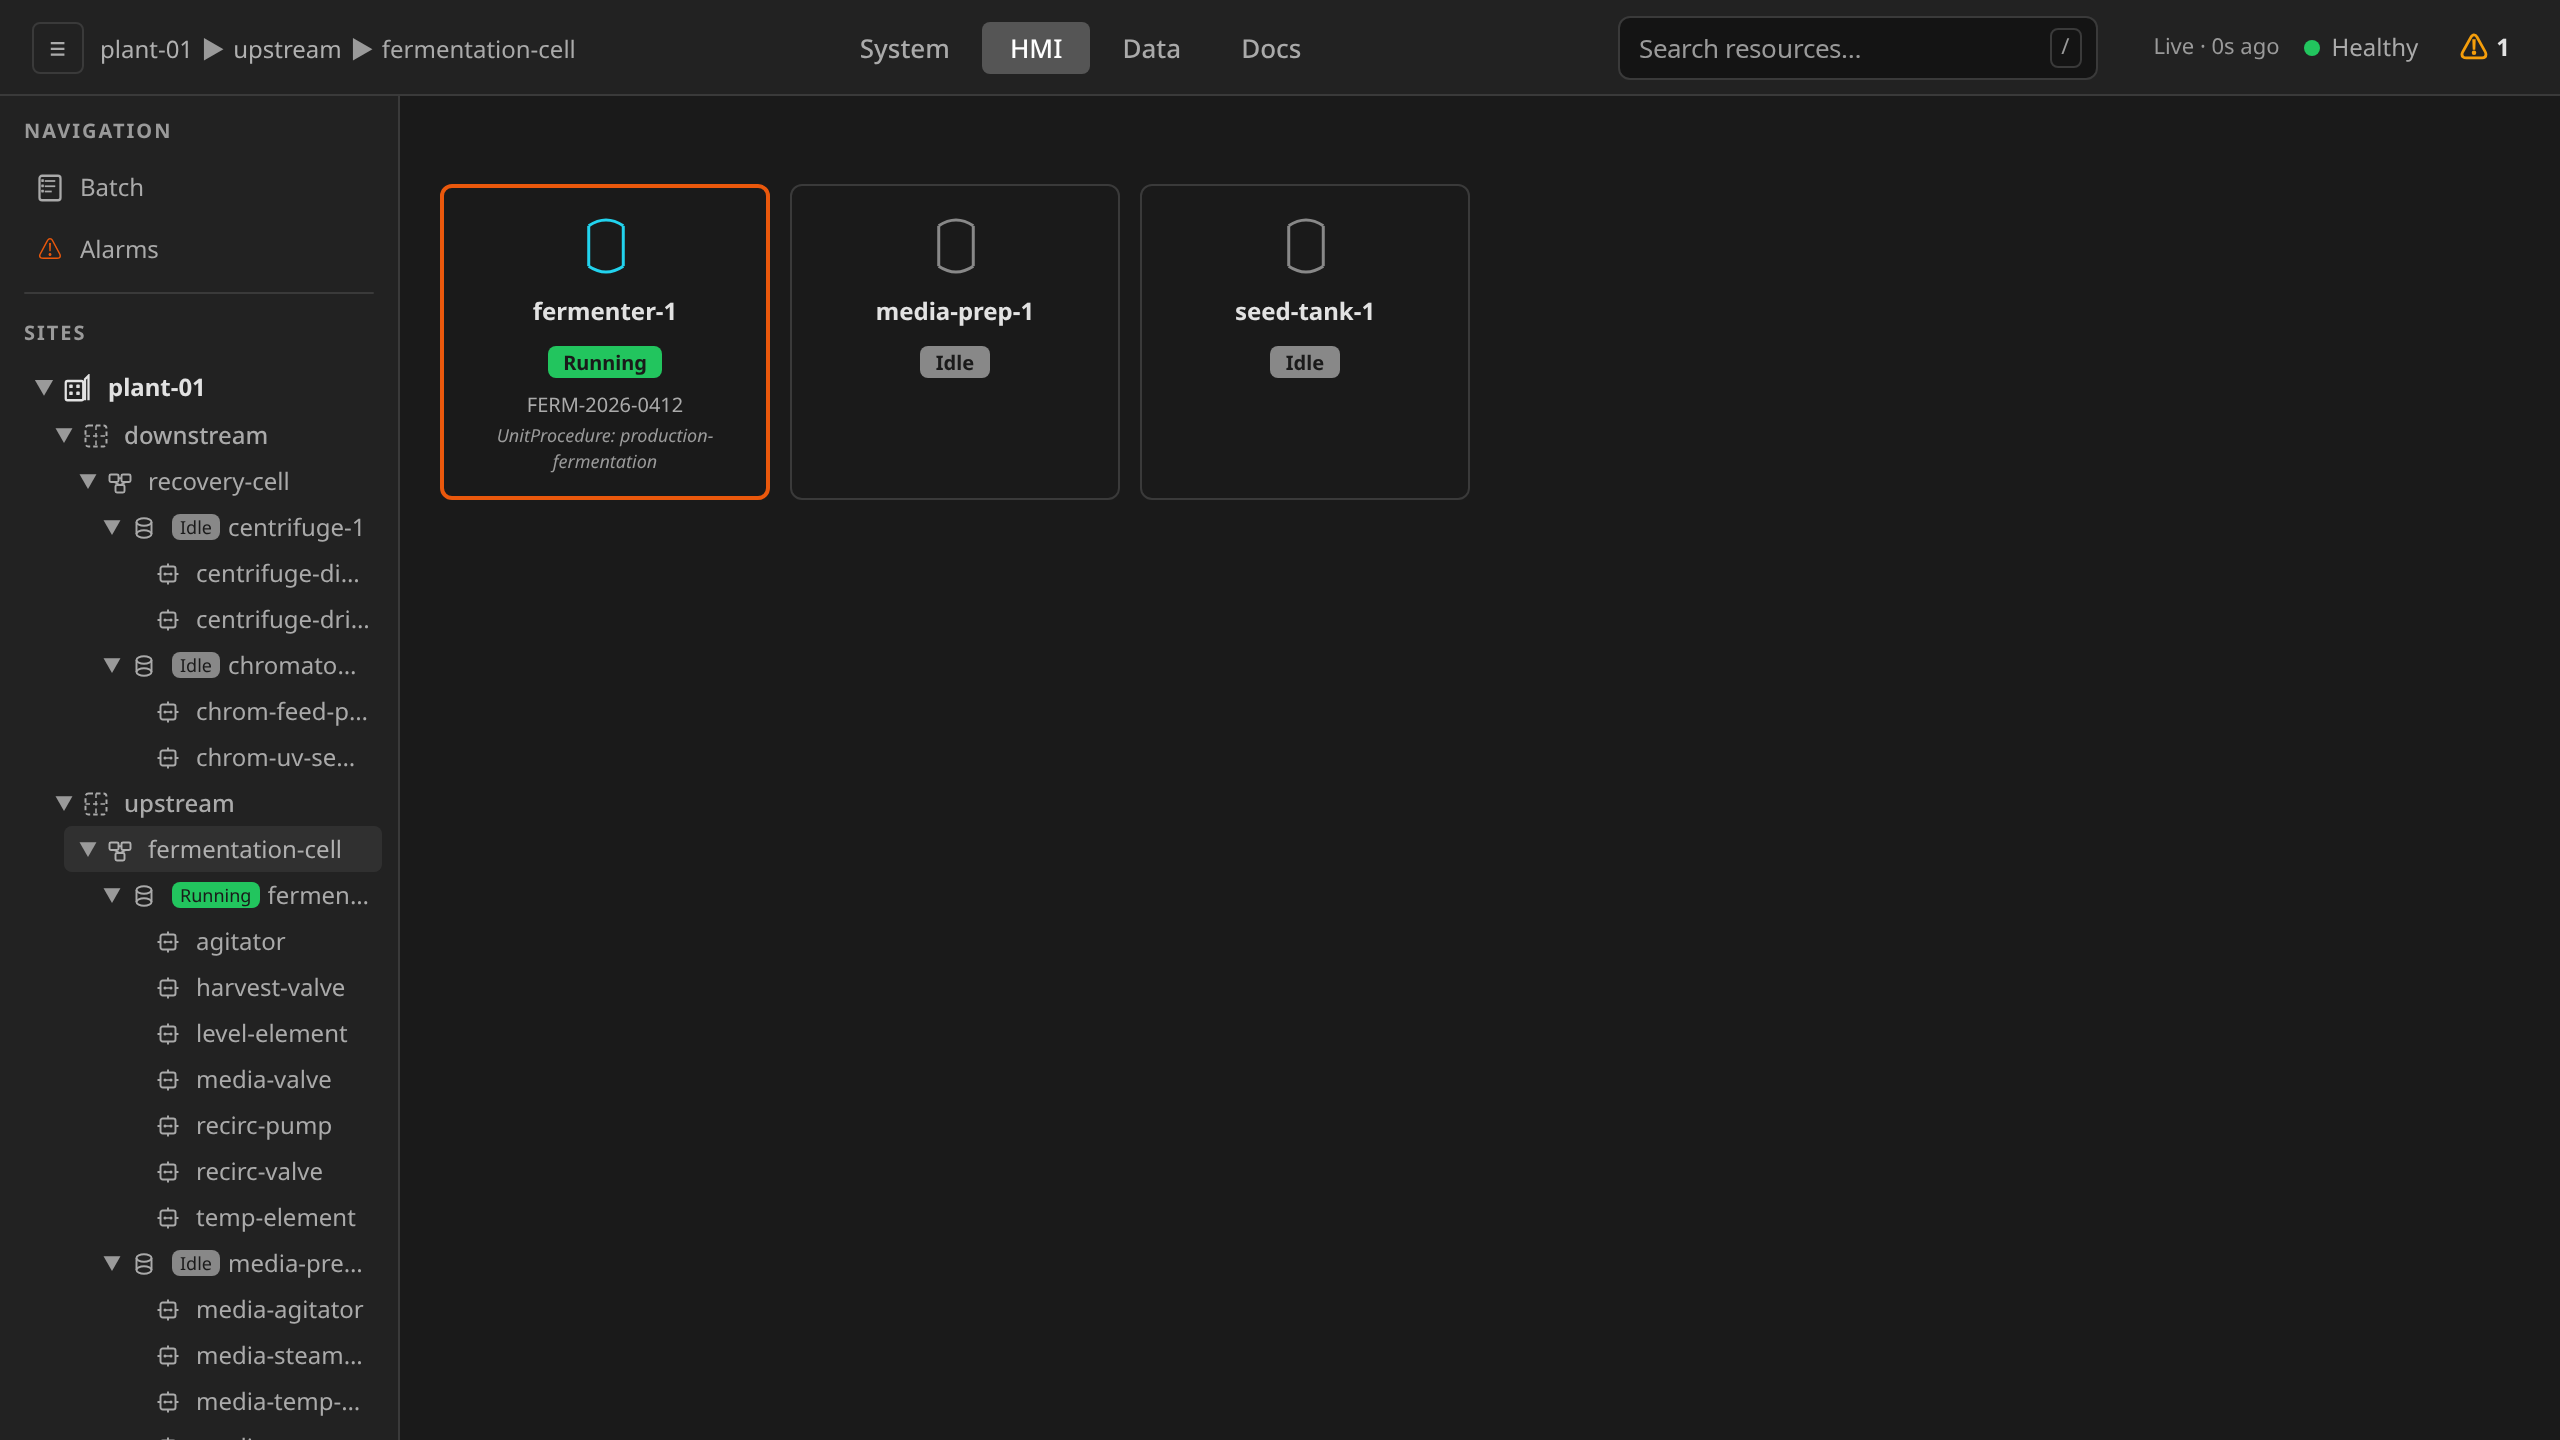
Alarmed unit cards in the process-cell view (/hmi →
Drilling into the alarmed unit outlines the unit's own header in amber, and only when the alarm's source is the unit itself. A child control module's alarm is annunciated on that module's card instead, which is what keeps the cue pointing at the thing that raised it.
Both surfaces carry an inline alarm strip. On the unit header the strip lists the alarms the unit itself raised, each row carrying the severity, the message, how long the alarm has been standing, and an Ack button. It draws at most three rows, most severe first, and says how many it did not draw. The title always counts every unacknowledged alarm on the unit, so the cap never hides how many there are. A faceplate open for an alarming control module carries the same amber border and its own strip, listing each unacknowledged alarm on that control module with a per-row Ack button. Both strips end in a View in Alarms link to the global view.
Acknowledging from either strip uses the same API and audit trail as acknowledging from the Alarms view. To shelve, still use the Alarms view.
Review historical alarms
The live Alarms view shows what's currently in flight. Long-term
history (resolved events, time-range queries, correlation with
batches and trends) is served by the historian. Two entry points reach
that data: the History sub-tab of the HMI alarms view (handy when
you're already triaging live alarms and want to look back without
leaving the sub-app), and the dedicated /data →
Alarm History view (full filters, deep-link URL, suitable for
post-incident review).
View alarm history
Open /hmi → Alarms and pick the History sub-tab beside
Active / All / Shelved. It lists the most recent 200 alarm events for
the site selected above it, defaulting to the last hour. The address
carries the tab, so the view survives a refresh and can be linked.
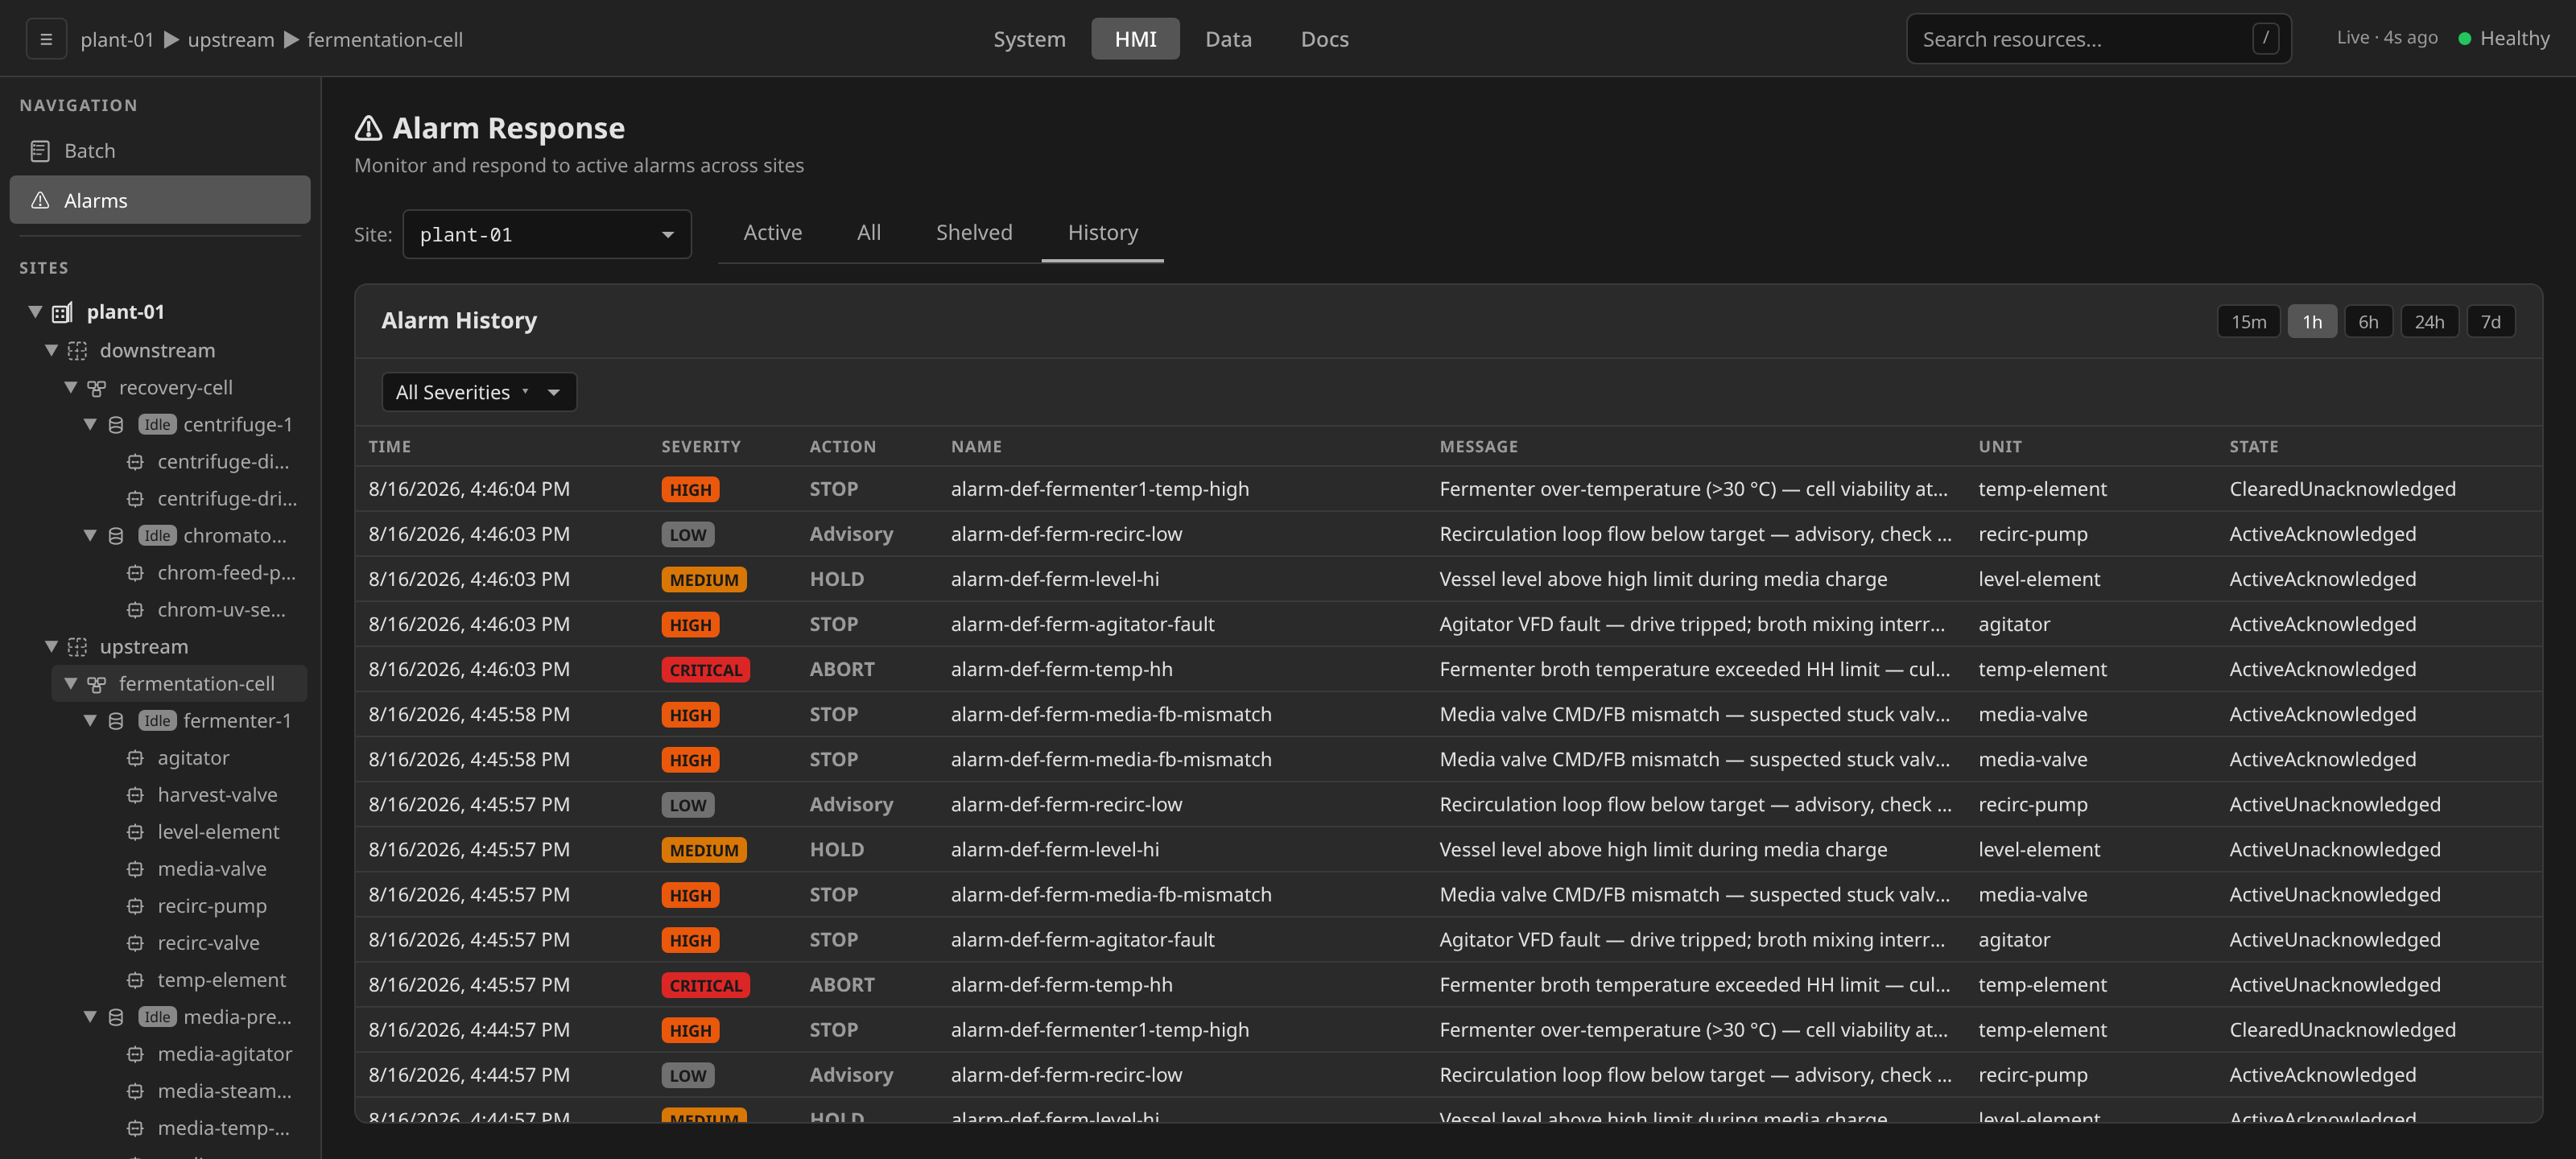
Pick Active to go back to the live list. The History tab is read-only. It doesn't expose Ack / Shelve actions, because those only make sense on alarms still in the working set.
GET /api/v1/historian/alarms?namespace=site-{site}&start={RFC3339}&end={RFC3339}&limit=200
Returns historical alarm events. The History tab calls this
endpoint directly. Permission: PermRead. See Historian
for retention and DTO details.
Filter history by range or severity
The panel header carries time-range buttons (15m, 1h, 6h,
24h, 7d) and a severity drop-down. Both re-query the historian:
a range button for its window, the severity drop-down with a
severity filter on the same query.
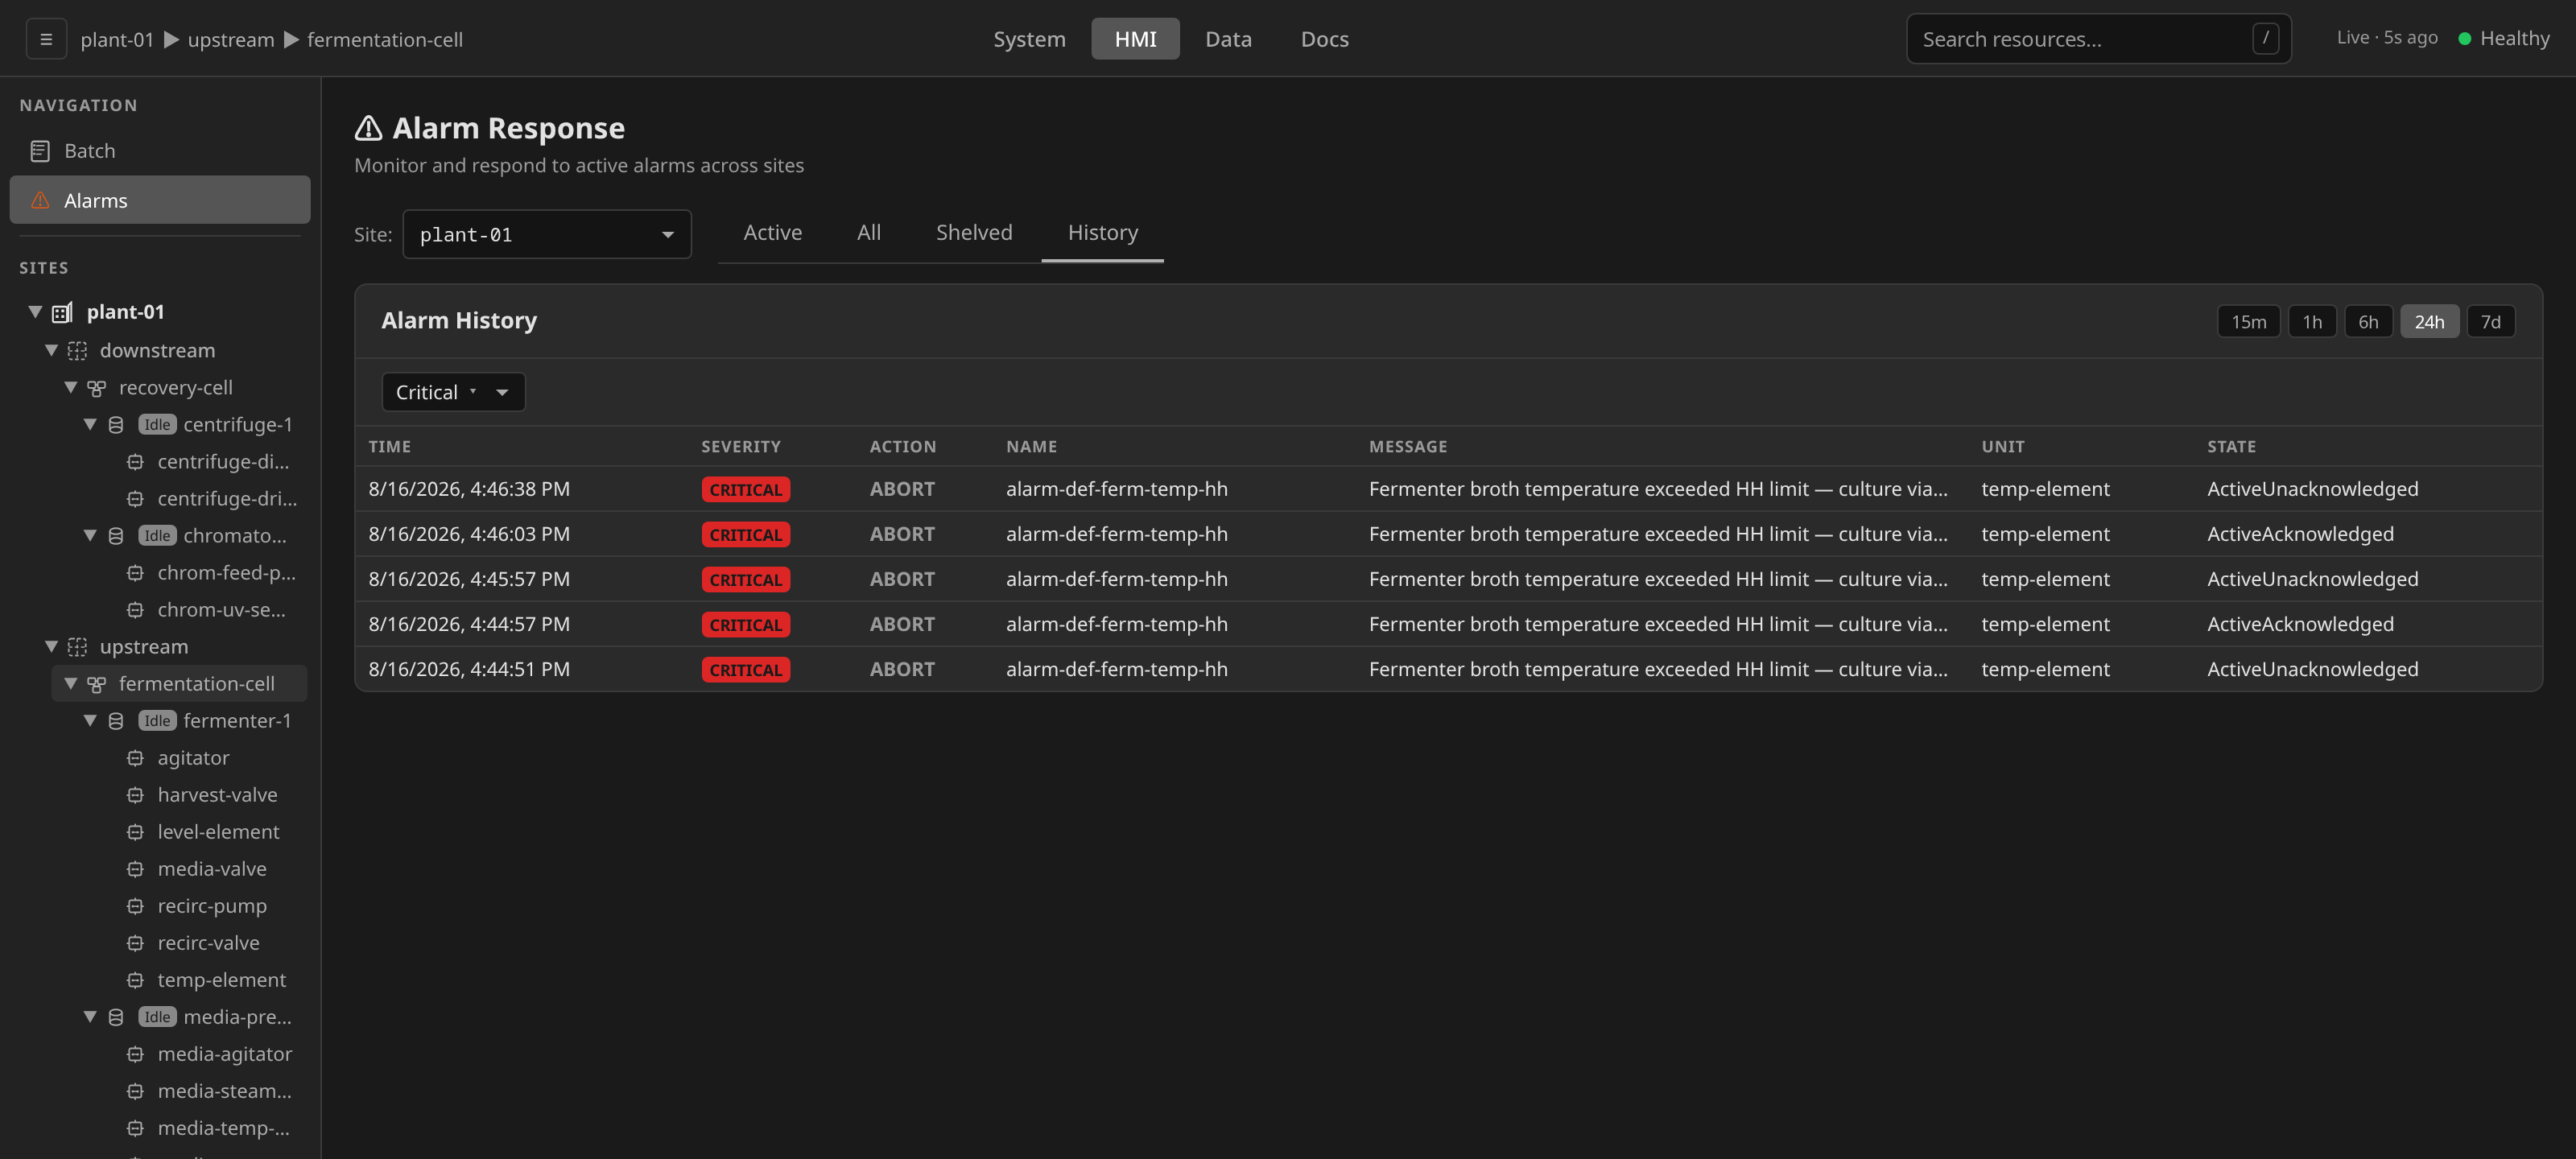
The range buttons set start and end query parameters and the
severity drop-down adds severity= to the same historian query.
For arbitrary time bounds, query /data → Alarm History
or hit the historian directly.
From the Data sub-app
/data → Alarm History is the full historian view: arbitrary
time ranges, severity / source filters, deep-link URL, and a stable
URL surface suitable for sharing in post-incident reviews. It's
backed by the same historian endpoint but is not constrained to the
HMI tab's 200-event ceiling.
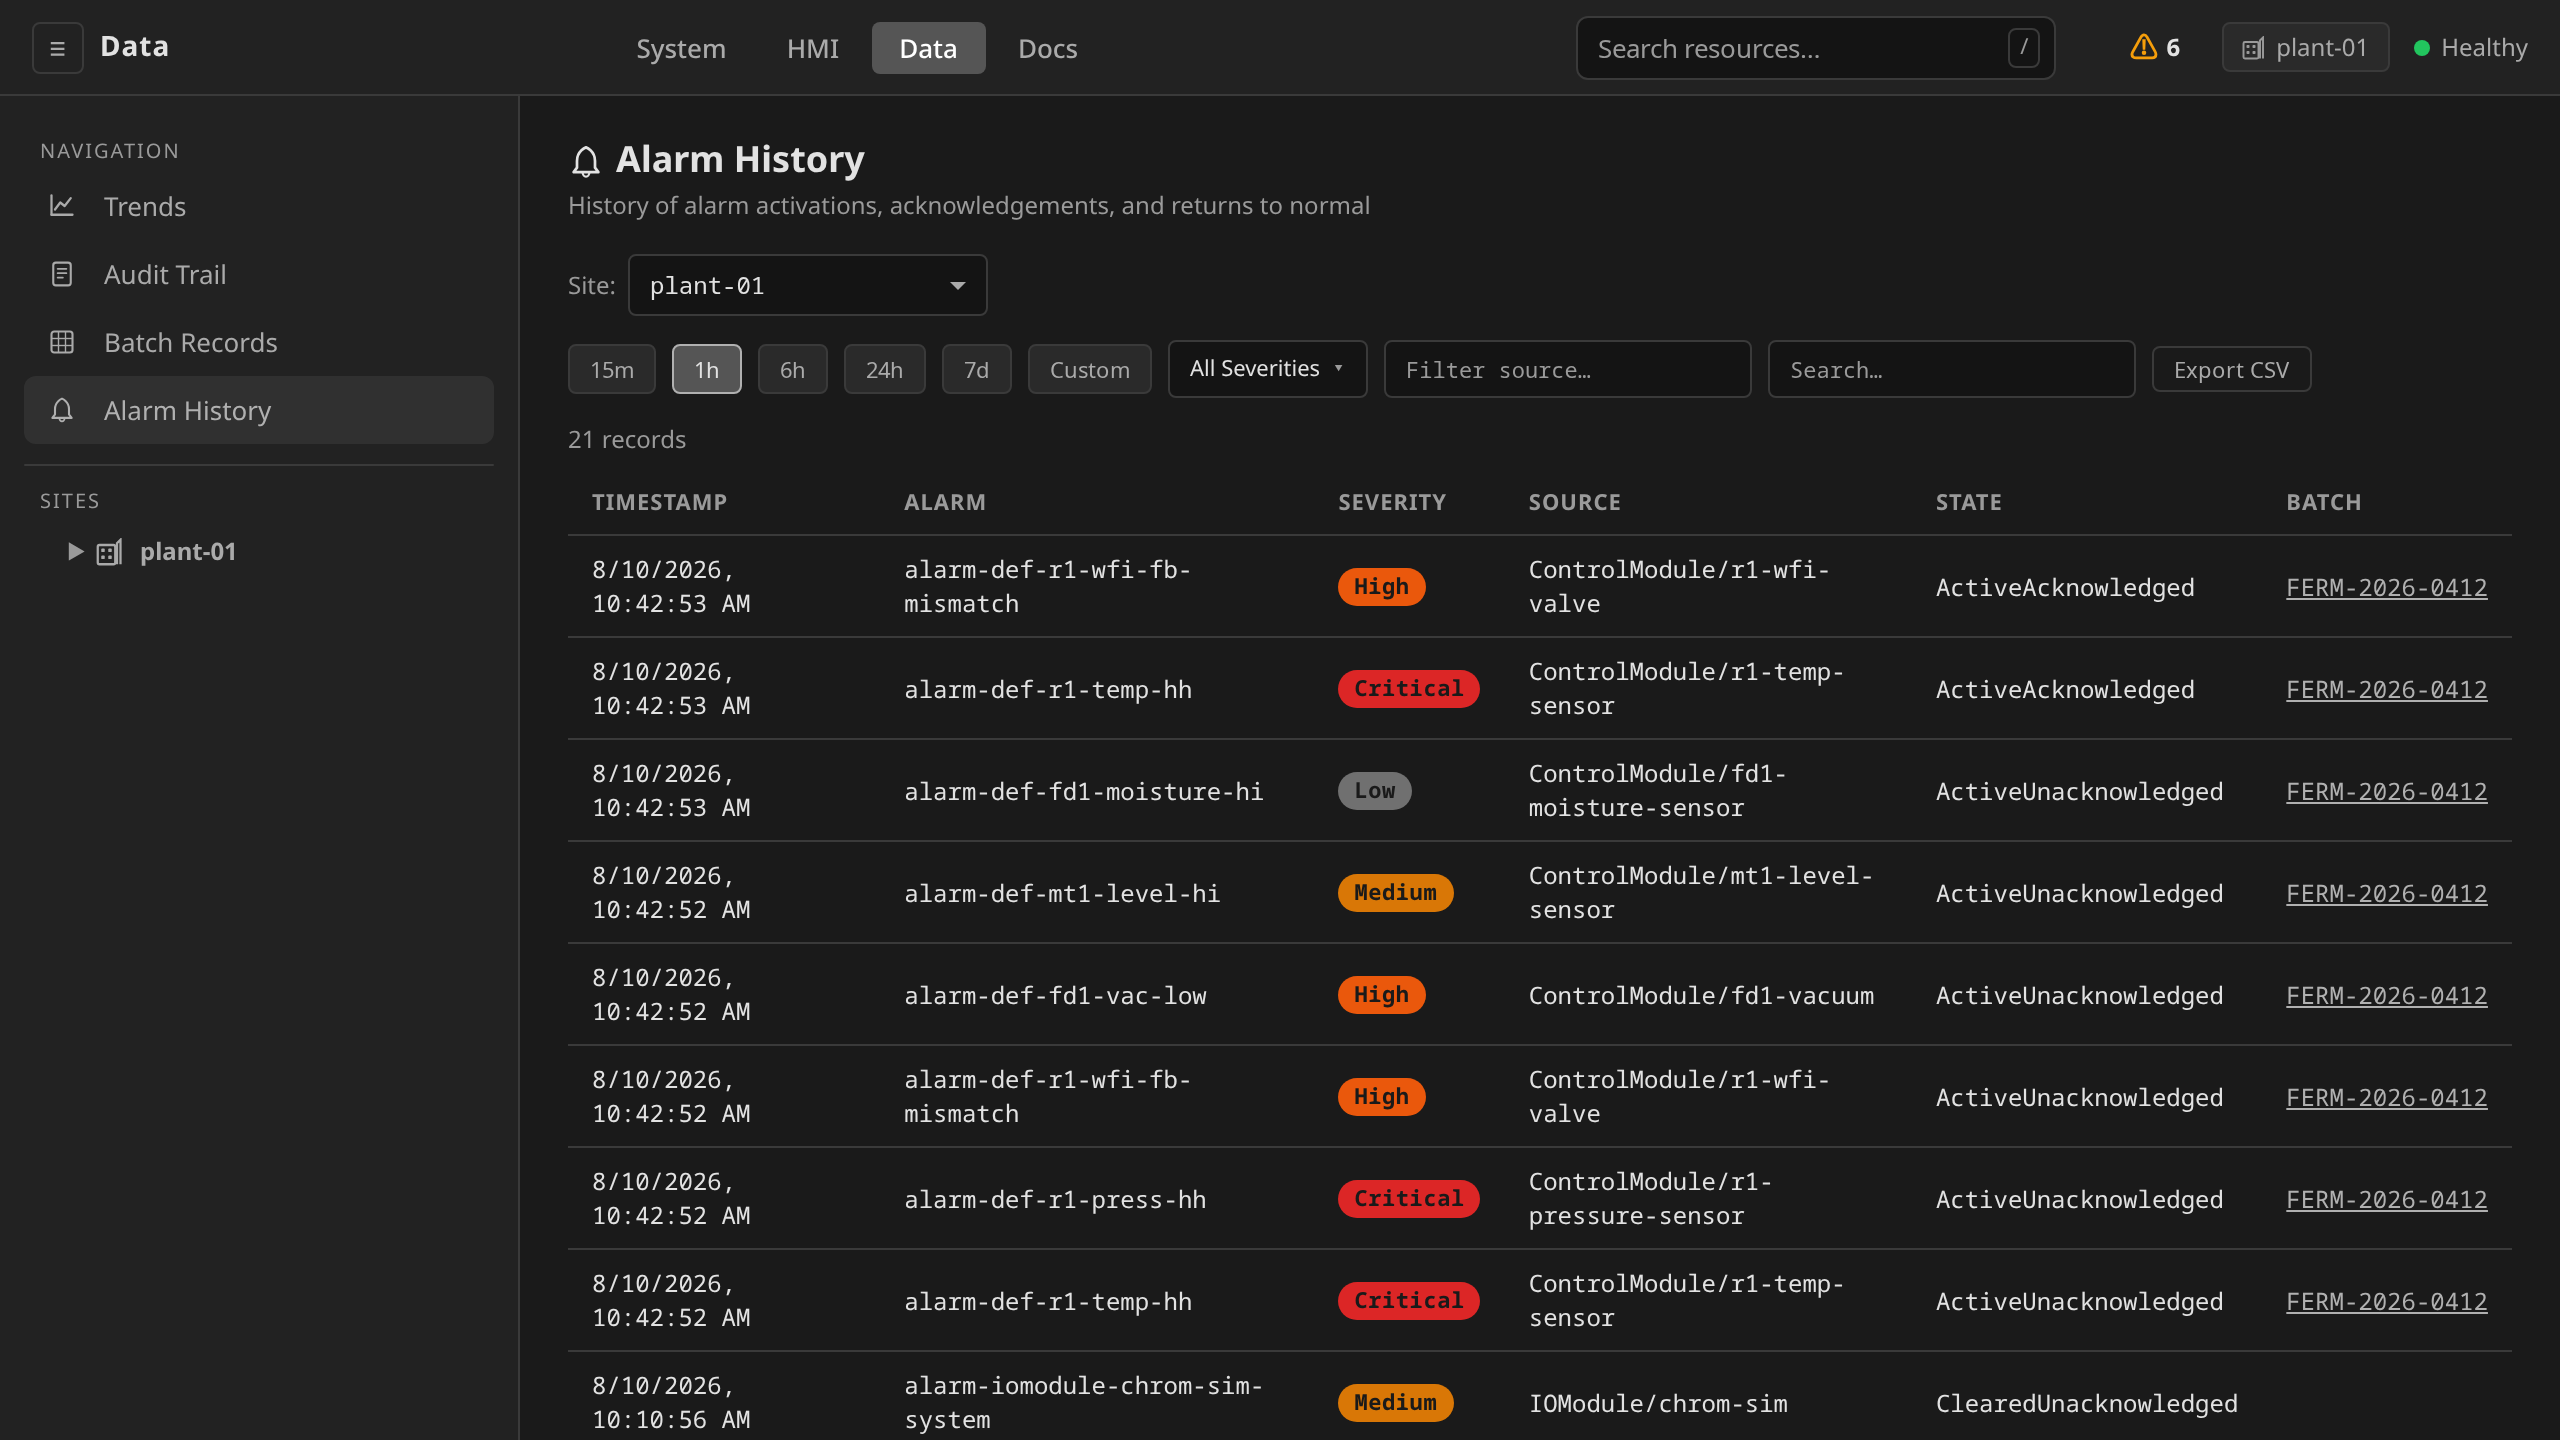
For the underlying API and retention semantics, see Historian. The same data is reachable per-equipment on the Data tabs of any ControlModule or Unit detail page.
Annunciation latency
The alarm path is instrumented end to end on the generator side: the
dcs_alarm_annunciation_latency_seconds histogram times each transition
into ActiveUnacknowledged from the instant the generating reconciler
observed the condition met to the broker accepting the retained
AlarmEvent publish. That publish is the transport every annunciation
consumer subscribes to, so the number is the system's own contribution
to annunciation delay. Consumers add their transport on top: the HMI
its alarm poll interval, an external SCADA or notifier its broker round
trip. A configured activation debounce is excluded by construction.
The window opens at the evaluation that fired. The first raw excursion
sits earlier, and the debounce between the two is engineered intent
counting as no part of system latency.
A published latency budget will be documented here once the
#943
soak has produced measured numbers to stand behind. That soak reports the
distribution per generator. hack/soak.sh report breaks the histogram
out by origin and prints p50/p95/p99 over the window, so the budget
recorded here comes from a trended 72-hour population. An individual
spot check carries no weight in it.
histogram_quantile(0.99,
  sum by (le) (rate(dcs_alarm_annunciation_latency_seconds_bucket[5m])))
Related Documentation
- Control Modules → Alarm definitions — engineering setup for alarm rules.
- Alarms and Interlocks — three worked patterns (valve MISMATCH, analog deviation, phase-level interlock).
- API Reference — full schemas for
AlarmandAlarmDefinition, plus thearmingGateand exception-action fields. - Historian — long-term alarm storage, retention, and query semantics.
- Monitoring and Metrics —
dcs_alarms_active,dcs_alarms_total, anddcs_alarm_annunciation_latency_secondsPrometheus series. - Web UI → Servers — the node inventory behind a server alarm.
- ADR 0032 — why server degradation annunciates as an alarm in every site.
- ADR 0036 — why planned maintenance shelves the server alarms it causes, and what it deliberately leaves annunciating.
- ADR 0037 — why a server alarm carries its own consequence, impact and response, and why the HMI gains no server surface.