Debugging a Running Batch¶
Engineers coming from traditional DCS and PLC toolchains expect a "go online, monitor, pause, poke values, online-edit" experience. This page walks the Cloud-Native DCS equivalents, with the honest caveats about what is and isn't possible today.
The short answer¶
- Watch a batch live — use
dcs watch states --unit <u>for the live procedural tree, the HMI Batch Execution view for the visual, orkubectl get batches --watchif you only care about phase transitions at the Batch level. - Inspect a phase's current state — use the Phase detail view in
/hmiordcs get phase <name> -o json. - Pause a batch without aborting — issue a
Holdcommand. Hold is ISA-88-recoverable viaRestart. - Force an I/O tag for testing — put the affected ControlModule
into Manual mode and write via the faceplate, or
POST /api/v1/writeagainst the unit runtime HTTP API. - Online-edit a PID gain during a running batch — not supported by default (hot-swap is gated while a batch is active). Annotated operator override is the explicit bypass path.
- Re-run a phase from a specific step — not supported. Use
Hold Restartfor recoverable deviations, orAbort+ new batch for non-recoverable ones.
Debugging toolkit¶
Keep these CLI commands one muscle memory away. Each answers a different question:
| Question | Command |
|---|---|
| What's the current state of every Batch in the site? | dcs get batches |
| What's the live procedural tree for this unit? (streams) | dcs watch states --unit <u> -i 2s |
| What alarms are active? (streams) | dcs watch alarms |
| What's a specific tag's value right now? | dcs get <cm>.<tag> (e.g. dcs get r1-pressure-sensor.PV) |
| Is the unit's runtime pod healthy? Where is it running? | dcs get runtime --unit <u> |
| Is the site healthy? Any pod restarts, CRD issues? | dcs health |
| Audit trail for a specific batch or CR? | dcs get auditrecords / dcs audit trace <batch-id> |
Watching a batch live¶
Open /hmi → Batch → click your batch row. The batch
detail view shows the full procedural tree (Procedure →
UnitProcedure → Operation → Phase) with the
currently-active SFC step highlighted and a per-step dwell timer.
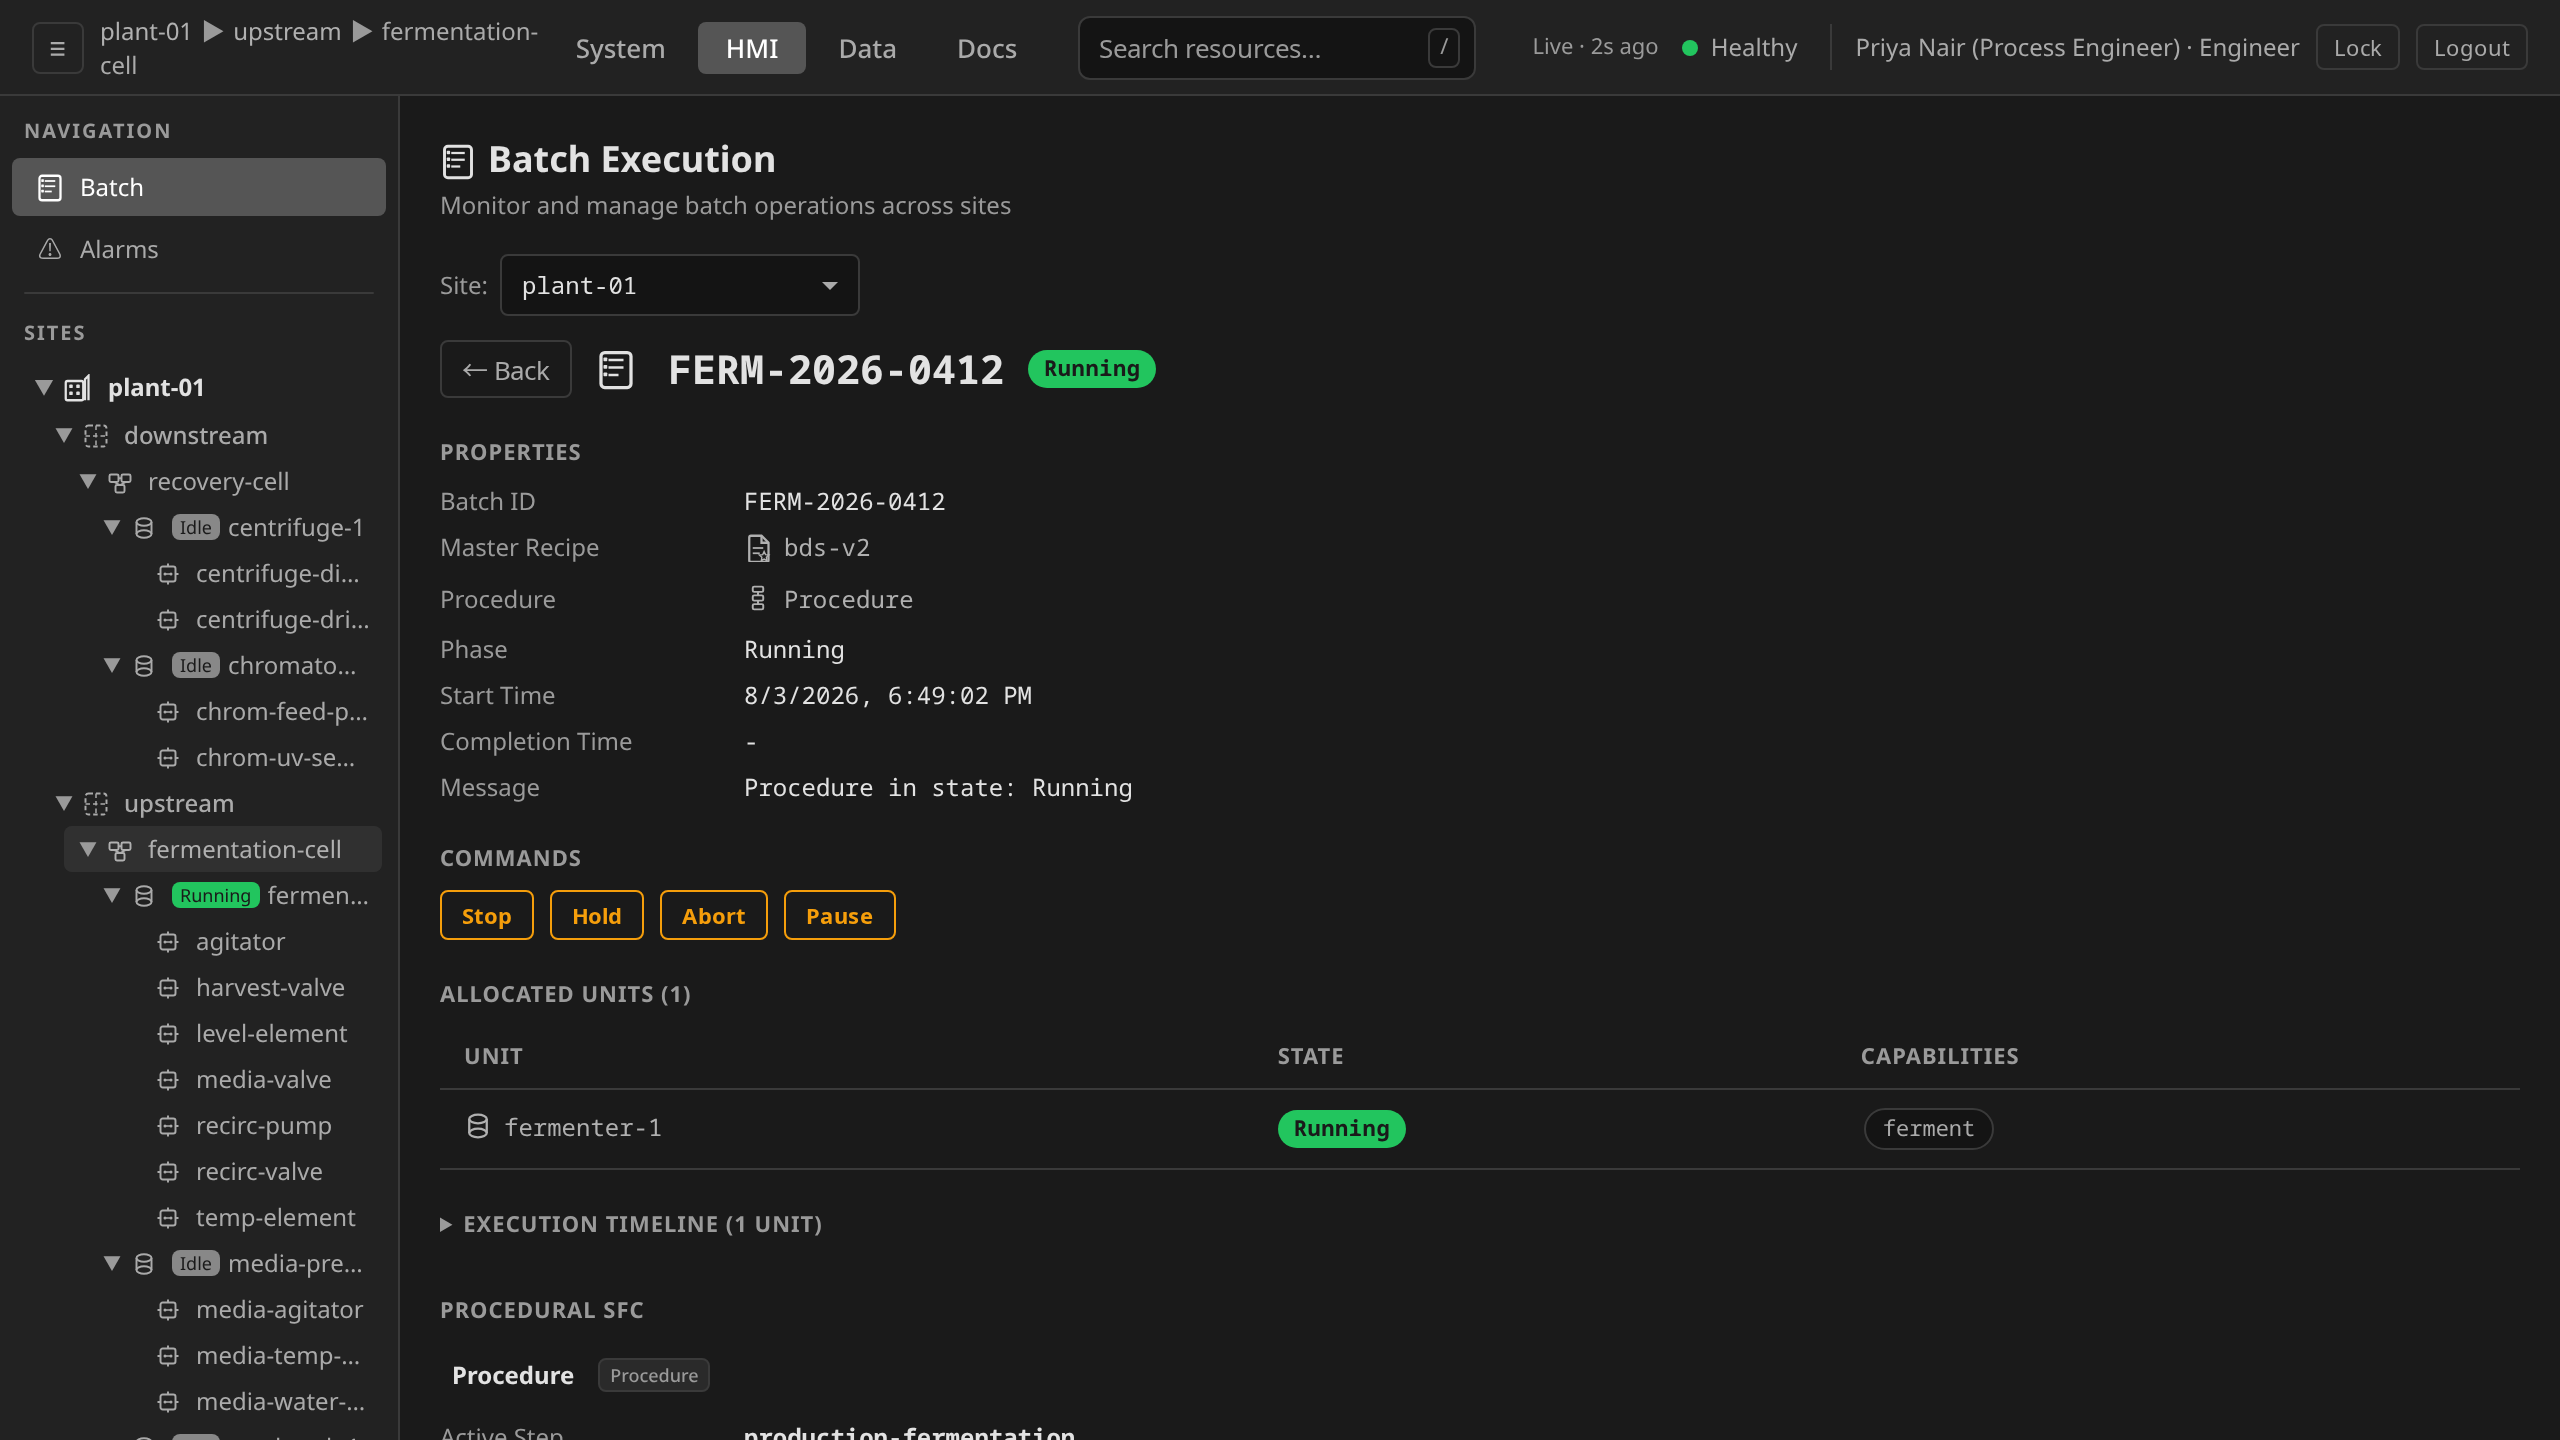
dcs --site plant-01 get batches
dcs --site plant-01 get batch my-batch-001 -o json
dcs --site plant-01 watch states --unit fermenter-1 -i 2s
dcs watch states streams the procedural tree live (Server-Sent
Events), and -i 2s sets the polling fallback interval. For a
programmatic consumer, the gateway also exposes a WebSocket at
/api/v1/ws and an SSE endpoint at /events/sse.
Inspecting a phase's SFC code¶
When a batch looks stuck or misbehaving, the next question is usually "what is that phase actually executing right now?" Open the batch's Procedural SFC viewer on the Batch detail and drill UnitProcedure → Operation → Phase by clicking each non-leaf step rectangle. At the Phase level, click any step or transition in the SFC diagram to open the code panel for that element.
Click a step rectangle in the SFC diagram. The code panel to the
right of the chart opens with the step's actionST, the
Structured Text the unit runtime evaluates while the step is
active. Live variable values appear inline on the matching
identifiers so you can see what the code "sees" right now
(READ('level_sensor.PV') shows the current PV, etc.).
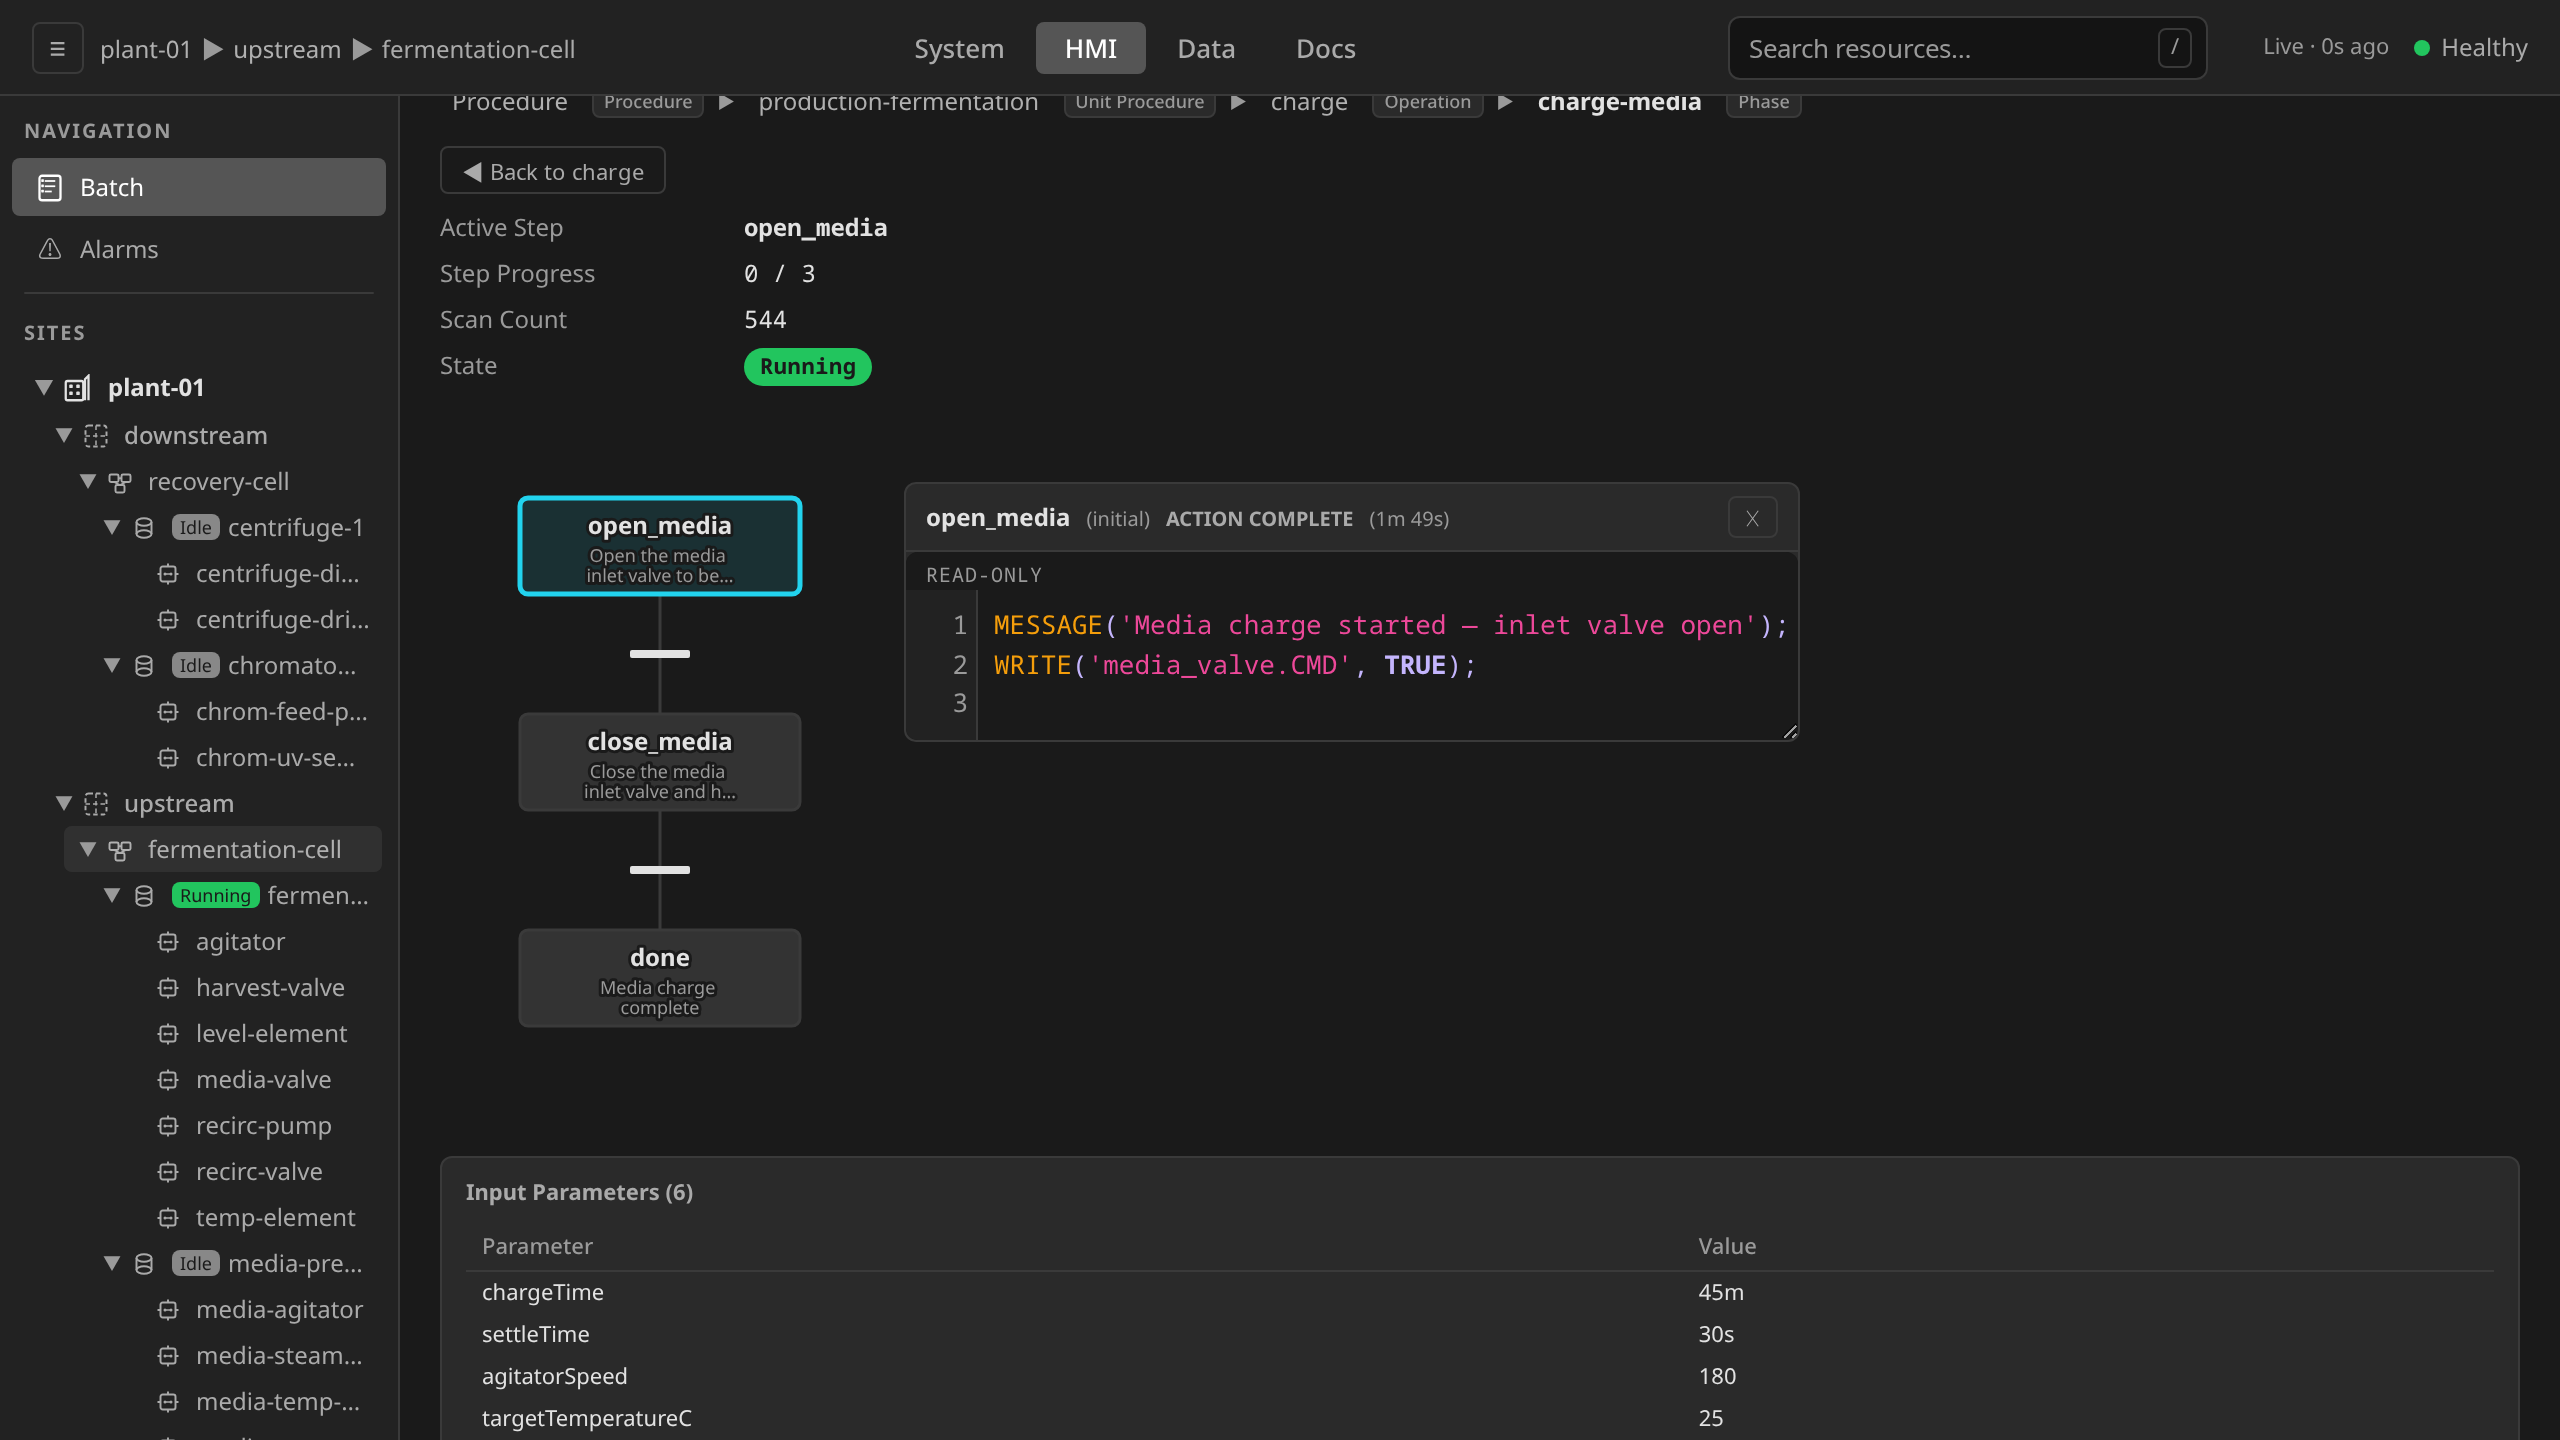
Click a transition bar (the short horizontal bar between two
steps). The code panel opens with the transition's conditionST,
the boolean expression that must evaluate to TRUE before the
SFC advances from the upstream step to the downstream step. For
mixing-dwell, that condition is
mix.T >= mixingTime (where mixingTime is a TIME-typed
parameter, the standard pattern for dwell timers).
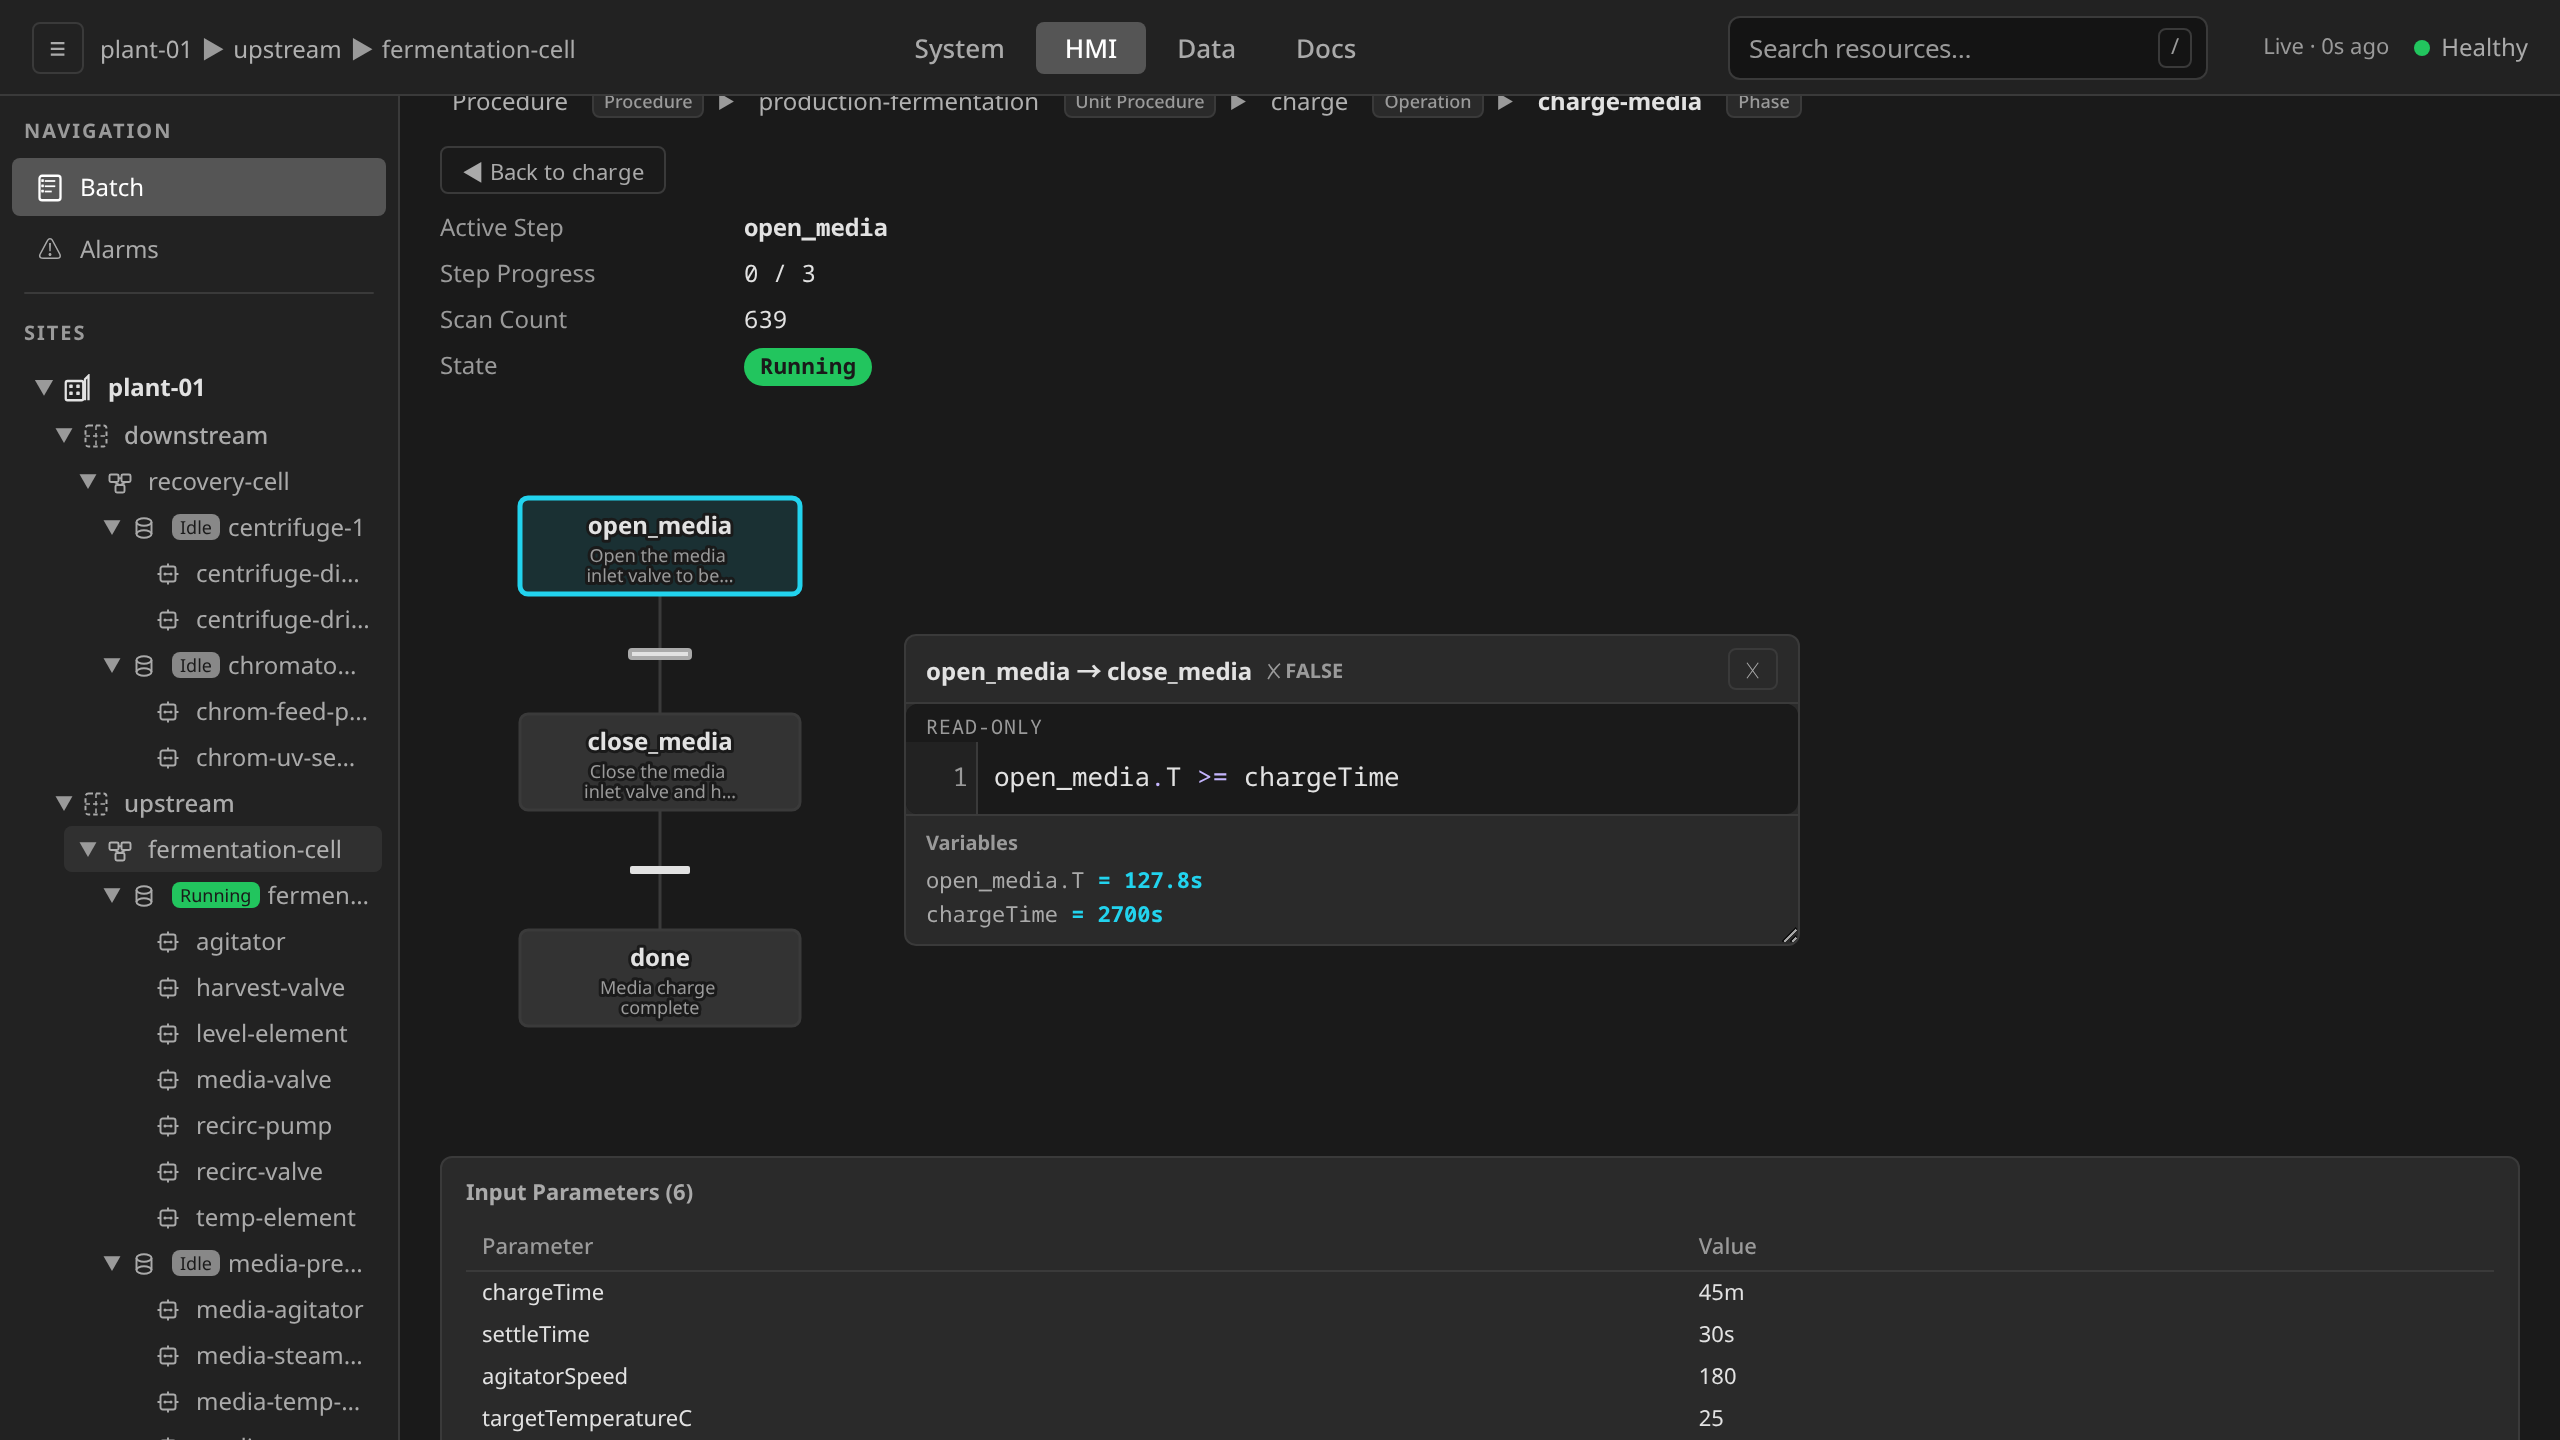
Both tabs' drill, filmed in one pass:
Audit trail trace¶
Every state transition is an AuditRecord:
/data → Audit Trail. Filter by target kind = Batch and
target name to narrow to one batch's lifecycle. For correlated
records across the whole tree (Procedure, UnitProcedure, Operation,
Phase under the batch), filter by correlation ID = the batch ID.
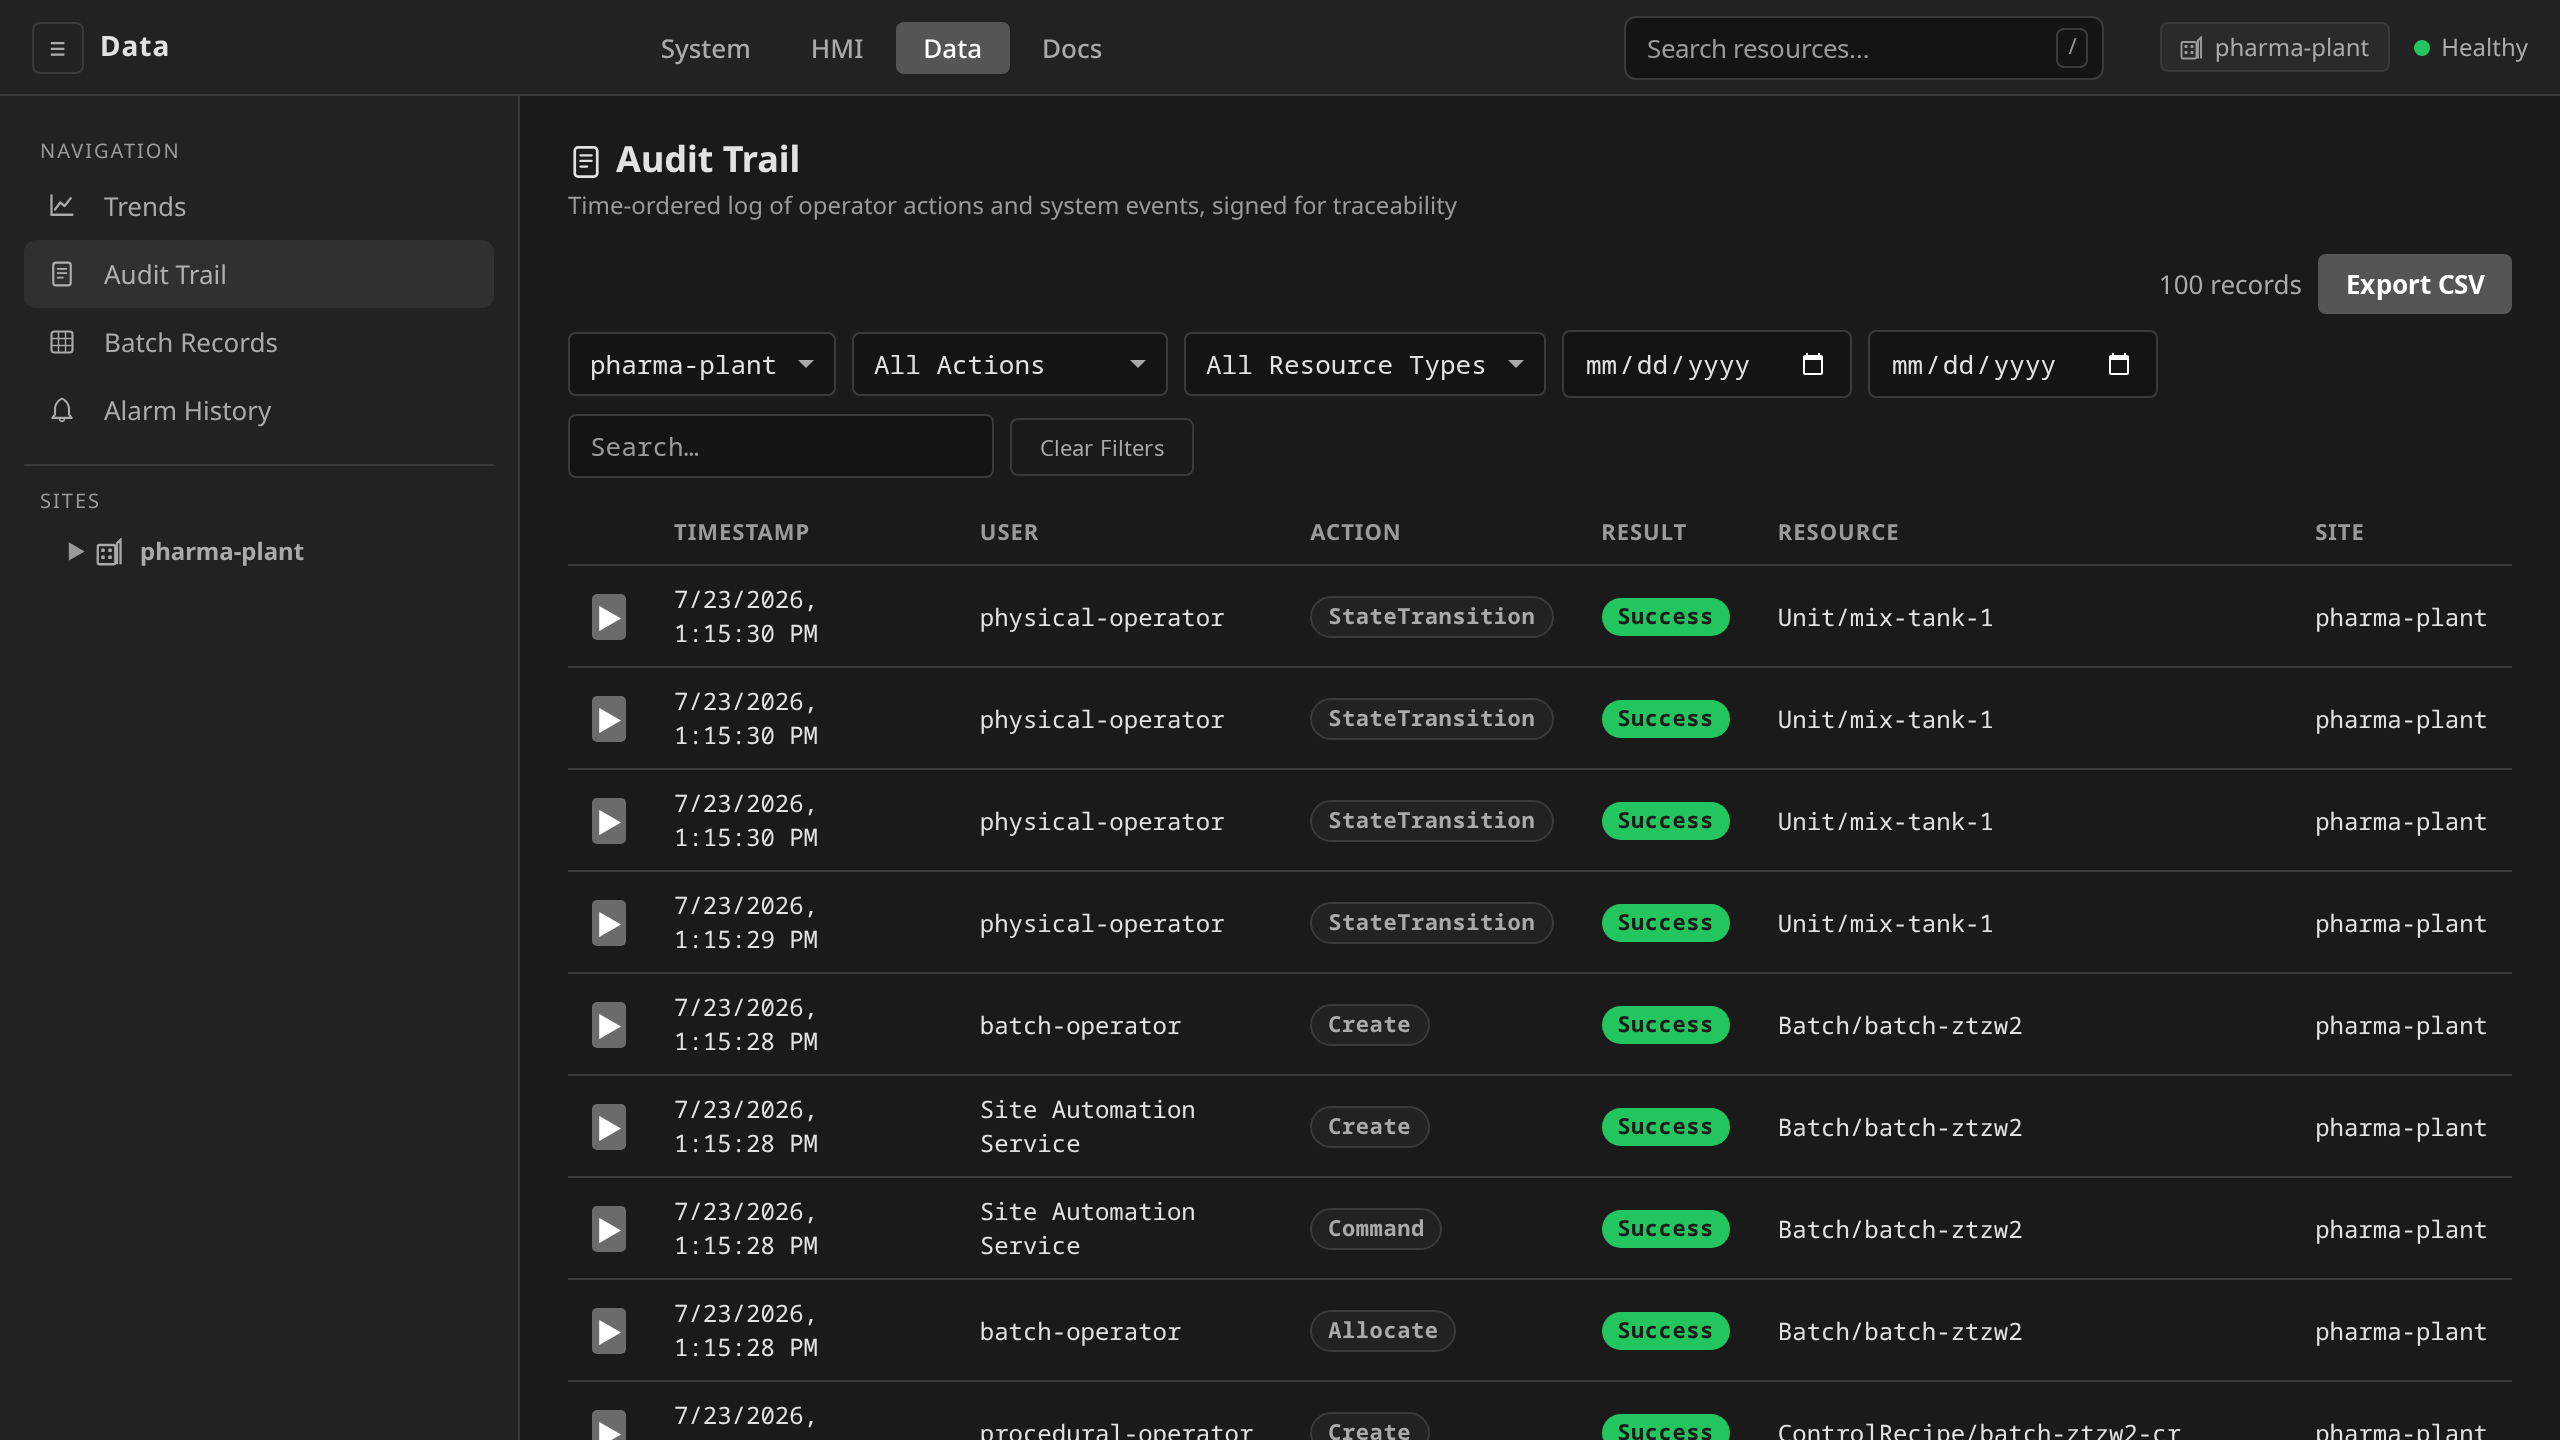
Batch, the correlation ID narrows to this batch's lifecycle, and clearing the kind widens the same correlation across the tree. The expanded Hold record carries the supervisor's reason verbatim.
# List recent records, filtered by target kind:
dcs audit export --target-kind Batch

# Or pull every AuditRecord correlated to a specific batch:
dcs audit trace my-batch-001
dcs audit trace takes the correlationID (typically the batch ID,
e.g. BATCH-2026-001) and returns every audit record tied to it.
Use the audit trail for "why did the batch go to Held" and "who acknowledged that prompt" questions.
Pausing without aborting¶
Four ISA-88 commands are relevant:
| Command | When to use it | Recovery |
|---|---|---|
Hold |
Recoverable deviation (out-of-spec value you want to inspect before continuing) | Restart resumes from the same SFC step |
Pause |
Operator needs a coffee break — procedural elements in Automatic mode pause at the next safe boundary | Resume continues |
Stop |
Clean stop at a safe boundary, with no in-place recovery | Reset returns to Idle; start a new batch |
Abort |
Emergency stop — go to safe state immediately | Reset returns to Idle; start a new batch |
The batch-operator cascades the command down the tree. Children
process it at their own pace. A Hold issued on the Batch becomes
Hold on the active Phase within seconds, which transitions the
phase's ISA-88 state machine and stops further SFC step advancement.
/hmi → Batch Execution → open your batch →
click Hold in the command bar. A confirmation expands under the
row: enter a reason and confirm. Hold is irreversible, so it asks.
When ready to resume, click Restart. That one is not
irreversible and sends straight away, with no reason asked. The
batch picks up from the same SFC step.
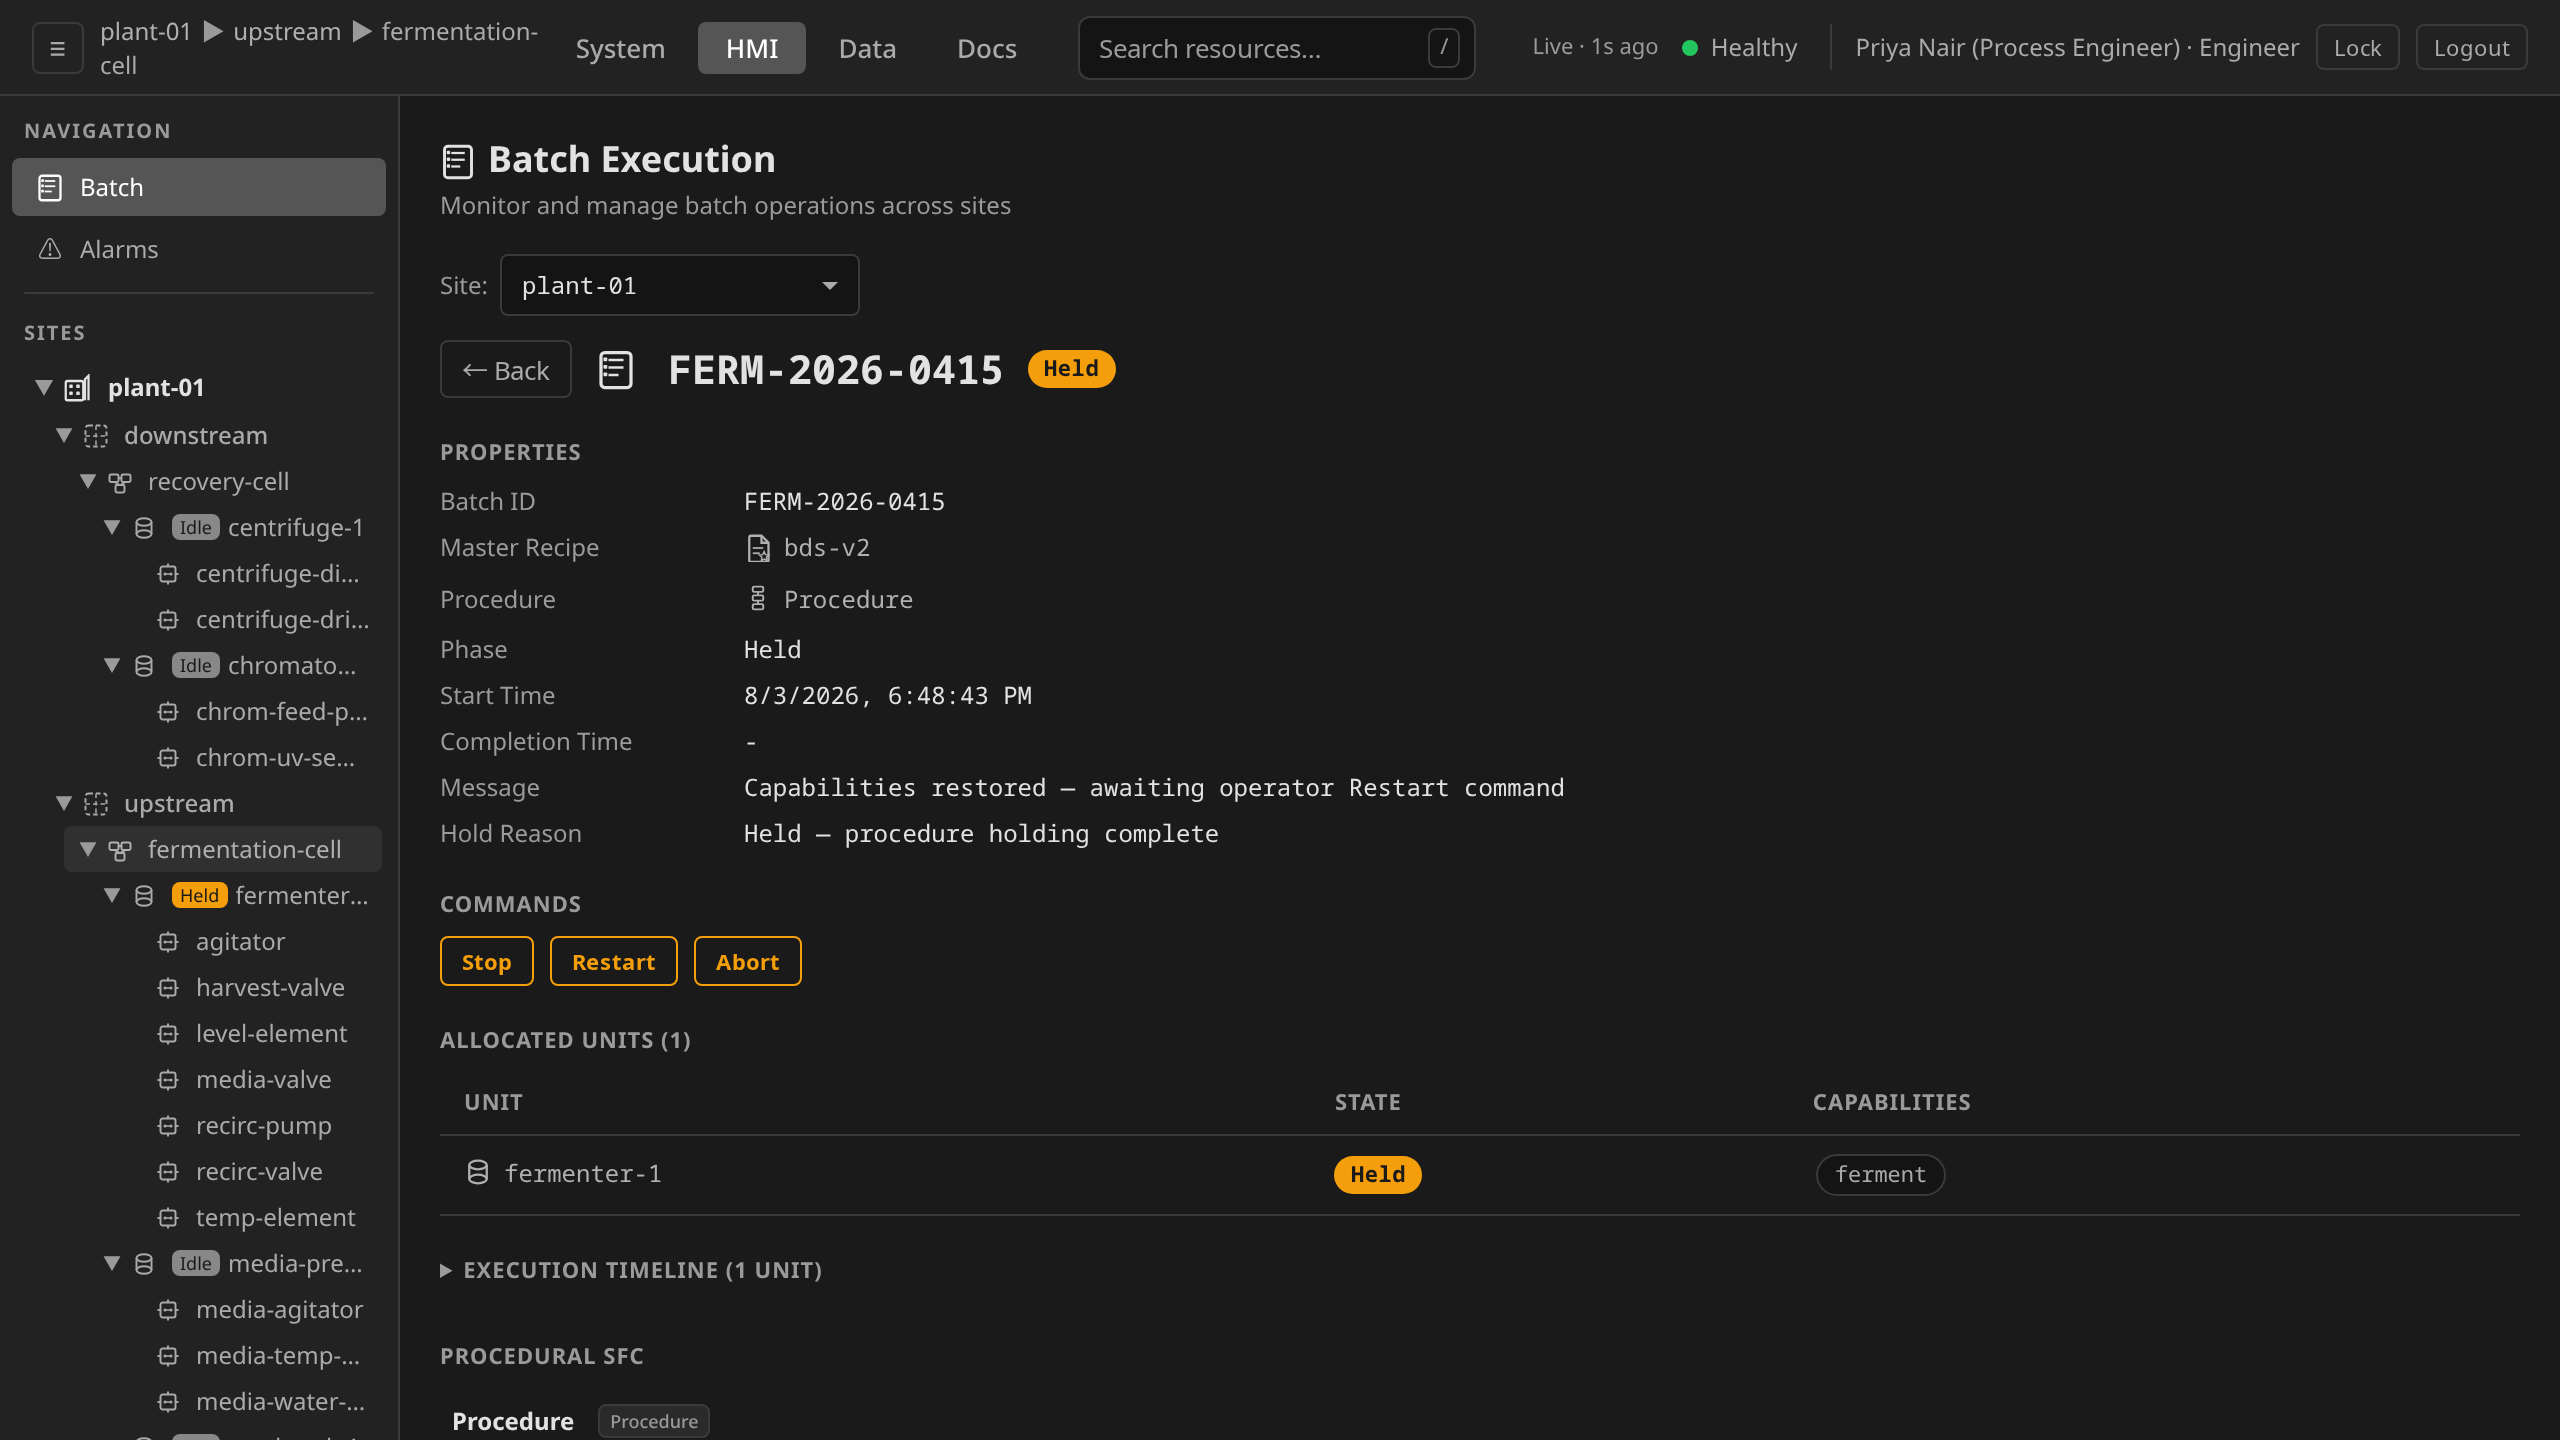
Held → Restart → back to Running from the same step, and the reasons in the audit trail afterward.
dcs command Batch my-batch-001 Hold    --reason "Temperature drift investigation"
dcs command Batch my-batch-001 Restart --reason "Drift was instrumentation noise, resuming"
--reason is required for the four irreversible commands
(Hold, Stop, Abort, Reset) and becomes part of the
audit record. Reversible commands like Restart, Resume,
Start, and Pause accept an optional reason but don't require
one.
Forcing an I/O tag for testing¶
Via faceplate (Manual mode)¶
- Open
/hmi→ unit detail → click the control-module card. - Switch mode from
AutomatictoManualusing the mode selector. - The faceplate now exposes a writable CMD field. Changes here bypass the function-block network's normal command path.
- Switch back to
Automaticwhen done.
Manual mode is an ISA-88 Part 1 Clause 7.3 (modes and states) concept. It is not a backdoor. Every Manual-mode write creates an AuditRecord with the operator's identity. Use it in development. Treat it as a controlled deviation in production.
Via the unit runtime HTTP API (developers only)¶
The runtime exposes direct read and write endpoints:
curl -H "Authorization: Bearer $RUNTIME_TOKEN" \
  --cacert ca.crt --cert client.crt --key client.key \
  -X POST https://<runtime-host>:61152/api/v1/write \
  -d '{"address": "reactor-sim:analog.10", "value": 75.0}'
This bypasses mode management and is strictly for development and test clusters. Production NetworkPolicies restrict this port to the control-operator ServiceAccount only.
The online-edit question¶
A traditional DCS engineer will ask: "I noticed my reactor PID Ki is
too aggressive and the loop is oscillating. I want to reduce it without
stopping the batch. How?"
Default answer: hot-swap is gated¶
By default, hot-swap of a ControlProgram is blocked while any Batch
on the affected unit is in Running, Holding, Held, or Aborting.
This is the runtime safety gate: no one silently retunes a
running batch.
In production namespaces (dcs.io/production=true), a separate
change-control gate runs at admission time: the ControlProgram
mutation itself must arrive through an allowlisted ServiceAccount with
an external-reference annotation and an HMAC electronic signature. The
two gates compose: an approved change still waits for the batch to
clear, or takes the allow-hot-swap override path described below.
See Change Control.
The control-operator sets a HotSwapDeferred status condition on the
ControlProgram, emits a Rejected AuditRecord correlated to the
blocking batch, and requeues every 30 seconds. As soon as the batch
leaves its active phase, the deferred update applies automatically.
Editing or deleting a composite block type is gated the same way, on
every program that uses it. A block type is shared, so the change
appears on no ControlProgram at all. The deferral lands on each affected
program instead. Look for HotSwapDeferred on the programs themselves,
and expect one deferral per unit that a batch is holding.
Operator override¶
If you deliberately want to hot-swap during a running batch (e.g.,
CAPA-driven tuning change, documented deviation), annotate the
ControlProgram with dcs.io/allow-hot-swap=true AND
dcs.io/hot-swap-reason=<text> before applying the spec change. Both
annotations are required, and allow-hot-swap=true on its own is
ignored. The trimmed reason is written verbatim into the resulting
Update AuditRecord so the override is permanently attributable for
§11.10(k) change-control purposes.
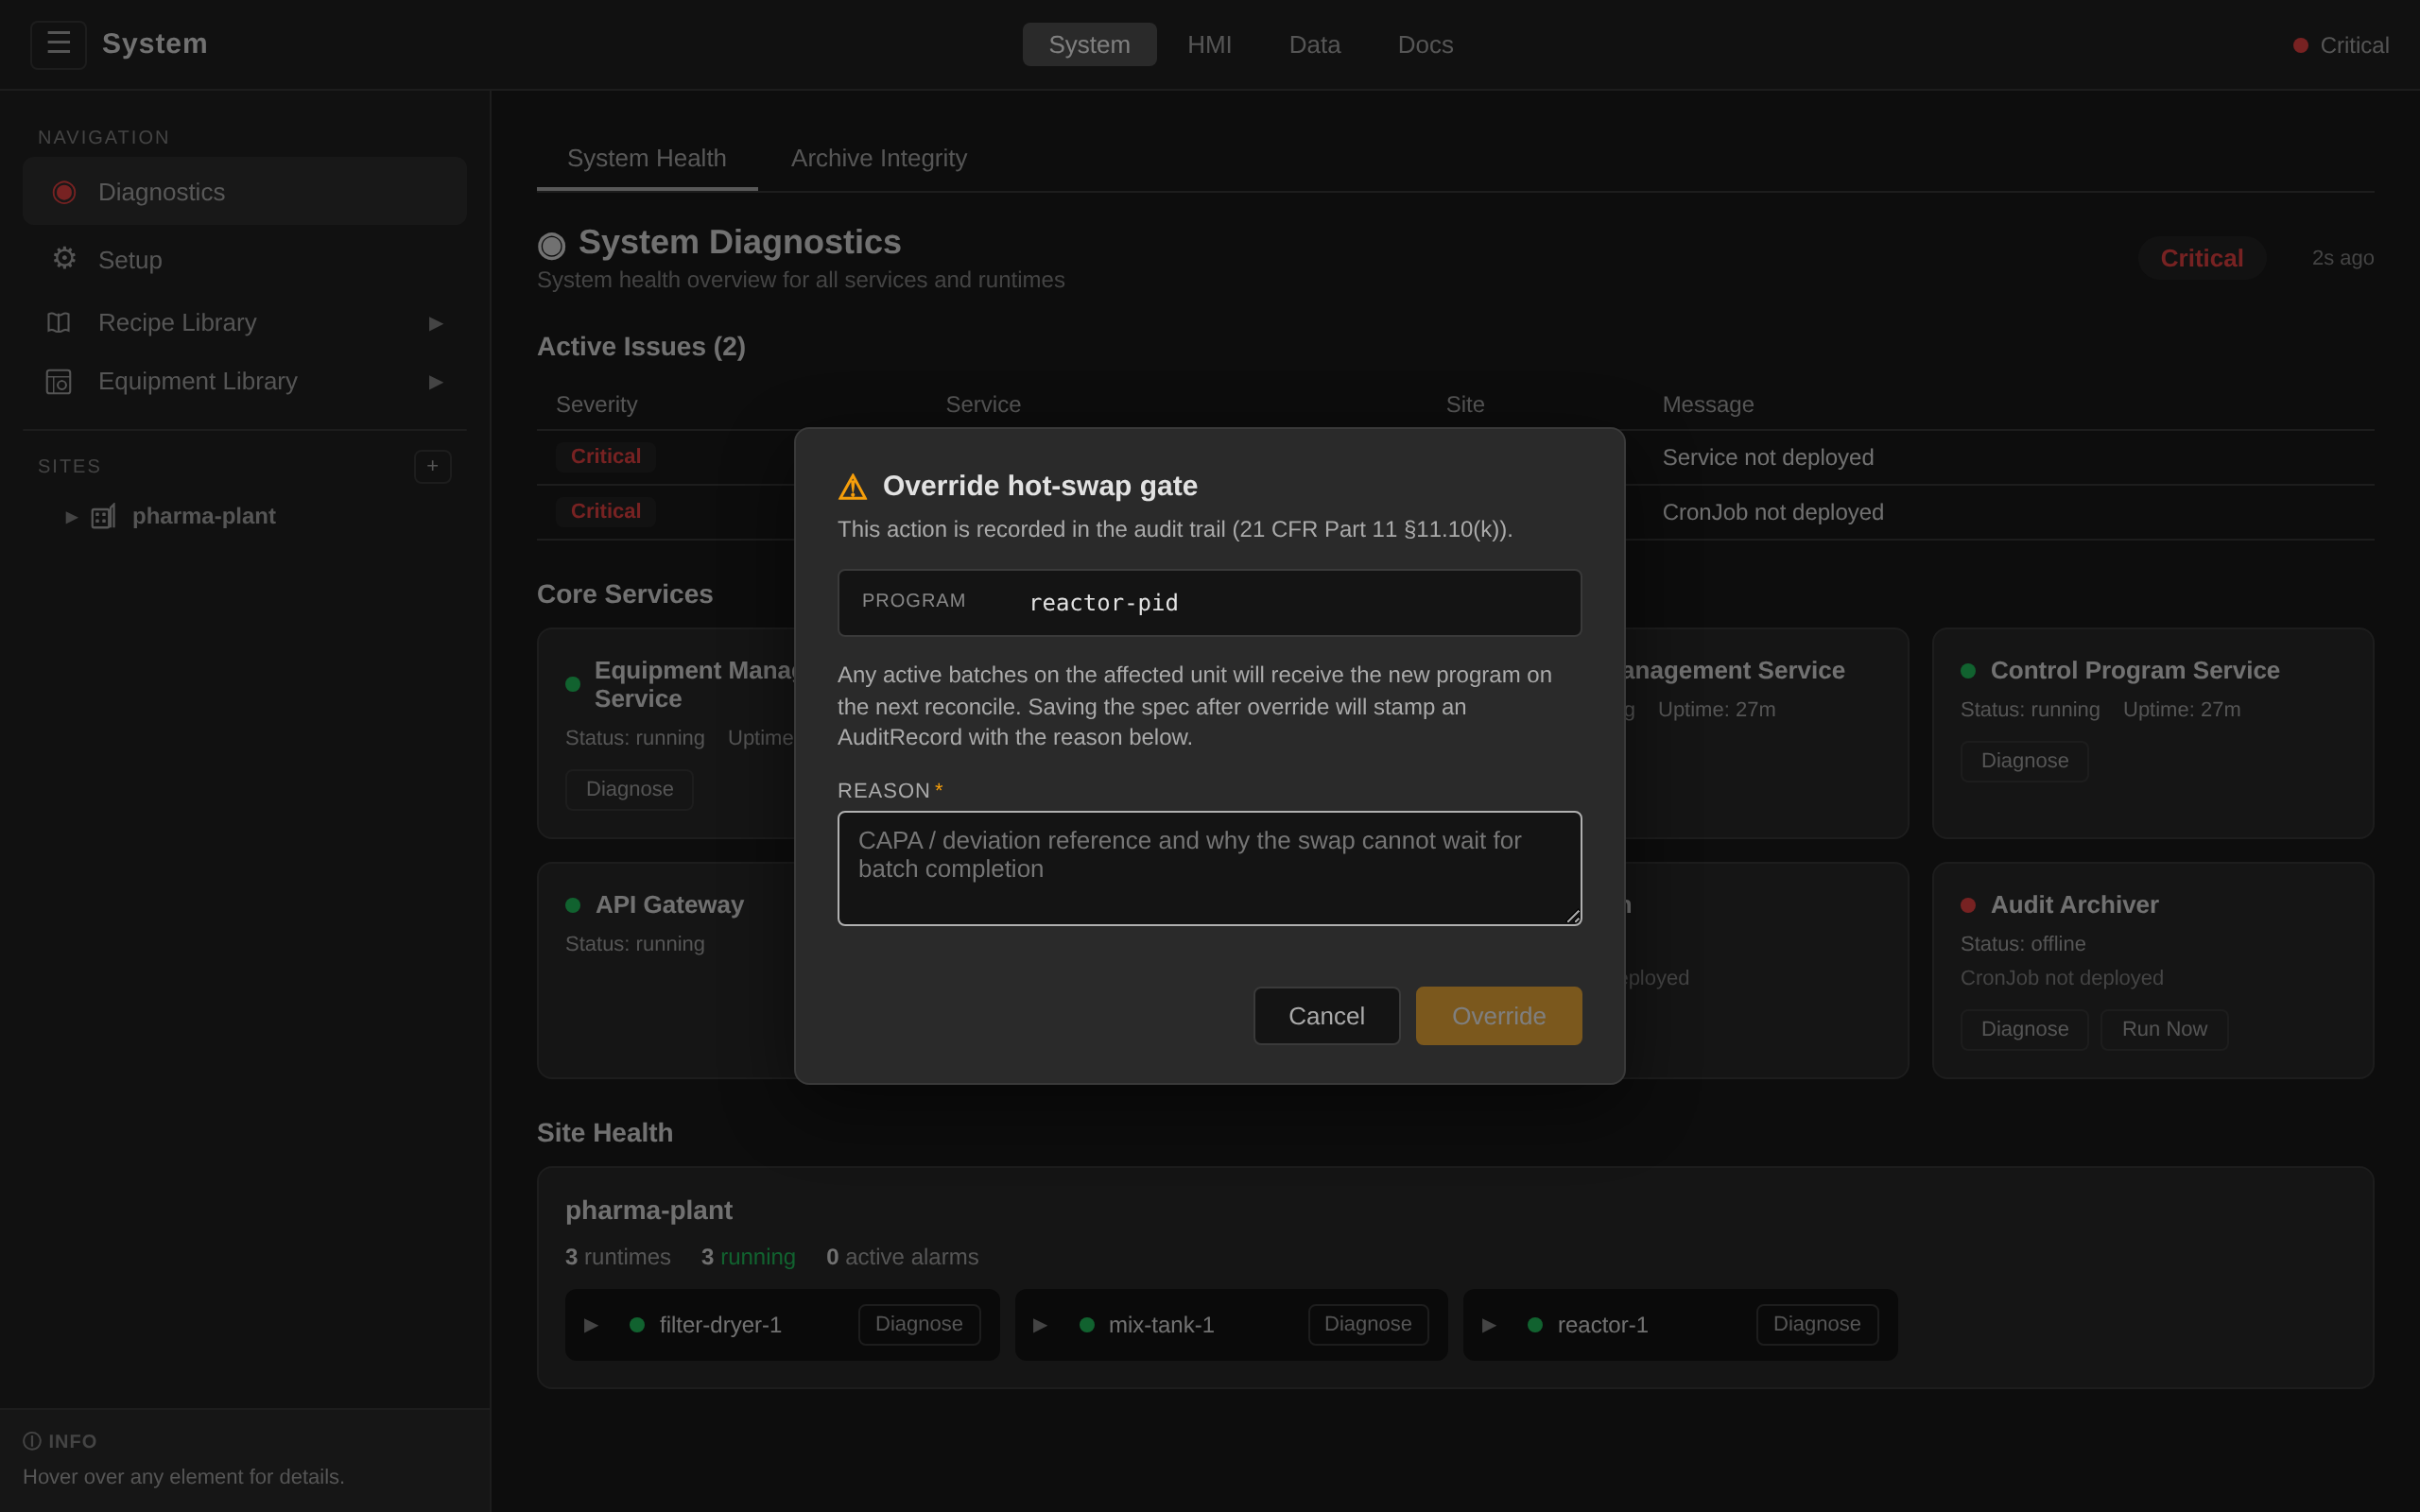
- Open the System app (
/system), expand the site to the affected Unit, and find the program in the unit's Control Programs section → Edit logic. That section lists the unit's standalone programs, and a program compiled from a ControlModuleTemplate is not one of them (see below). - In the editor toolbar, click Override hot-swap. The button is
offered to a session whose resolved action set carries
controlprogram:override-hot-swap(engineerby default, ADR 0024). A session without it opens the editor in view mode and is shown neither the override nor a Save. - The modal prompts for a Reason. Enter the CAPA or deviation reference and why the swap cannot wait for batch completion. The gateway rejects anything shorter than 10 characters after trimming, to keep the audit trail useful.
- Click Override. The gateway persists the
dcs.io/allow-hot-swap=trueanddcs.io/hot-swap-reasonannotations and writes an immediateUpdateAuditRecord carrying the reason verbatim (§11.10(k)). - The toolbar drops into edit mode. Modify the spec, then
Save. The control-operator detects the generation bump
and applies the replace path, writing a second AuditRecord
with
reason=hot-swap bypass: <your reason>.
ControlPrograms compiled from a ControlModuleTemplate are edited through the template. The gateway rejects a direct write to the instance, so the editor opens read-only for those and offers neither Save nor the override. Their logic is still visible on the control module's own detail page, under Control Logic.
kubectl -n site-plant-01 annotate controlprogram temp-element-logic \
  dcs.io/allow-hot-swap=true \
  dcs.io/hot-swap-reason="CAPA-2026-04-12: PID Ki reduced to damp oscillation observed during batch-7421"
Then edit and apply the ControlProgram:
kubectl -n site-plant-01 edit controlprogram temp-element-logic
# reduce the PID Ki parameter, save, quit
The control-operator detects the generation bump, confirms the
annotations, applies the replace path, captures an OverrideSnapshot
of any operator-commanded output forces so they survive the swap,
and writes the AuditRecord. Function-block internal state (PID
integrator accumulator, previous error, filter history) is not
preserved across the hot-swap today. The new network starts with
fresh block state, so expect a transient after a retune. If you need
bumpless transfer, stage the change via Hold → modify → Restart
instead.
An override applied while a batch is running is correlated to that batch's ID. It therefore appears in the lot's batch production record under Change History, with the before and after spec hashes and the reason you gave. A hot-swap on a unit no batch is holding is correlated to nothing, and it is found through the ControlProgram it targets.
Pod-recovery is never gated¶
The control-operator's initial-deploy path (reason=initial-deploy or
reason=pod-recovery) runs unconditionally. A freshly-restarted unit
runtime pod always receives its current ControlProgram from the
control-operator, regardless of batch state. Operator override
snapshots are replayed so forced outputs re-apply on the fresh
runtime. Function-block internal state starts from scratch (same
caveat as the hot-swap above).
What is NOT supported today¶
| Feature | Status |
|---|---|
| Online edit of an SFC phase chart while a phase is active | Not supported. Hold the batch, edit the PhaseTemplate, apply, then Restart. |
| Re-run a single phase step | Not supported. Phase-level Restart resumes from the last active step; finer-grained re-runs require aborting and restarting the phase. |
| Graphical SFC editor | Available in the System UI's Equipment Library → Phases view. YAML editing still works for everything the visual editor exposes. See Phases. |
| Bookmark/save a tag-group "watch window" | Not yet — the HMI unit detail view shows all CMs for the unit, with no user-saved subset. |
| Trend-group definition through the UI | Not yet — use the /data → Trends view to build an ad-hoc selection each session. |