Control Module: analog-sensor
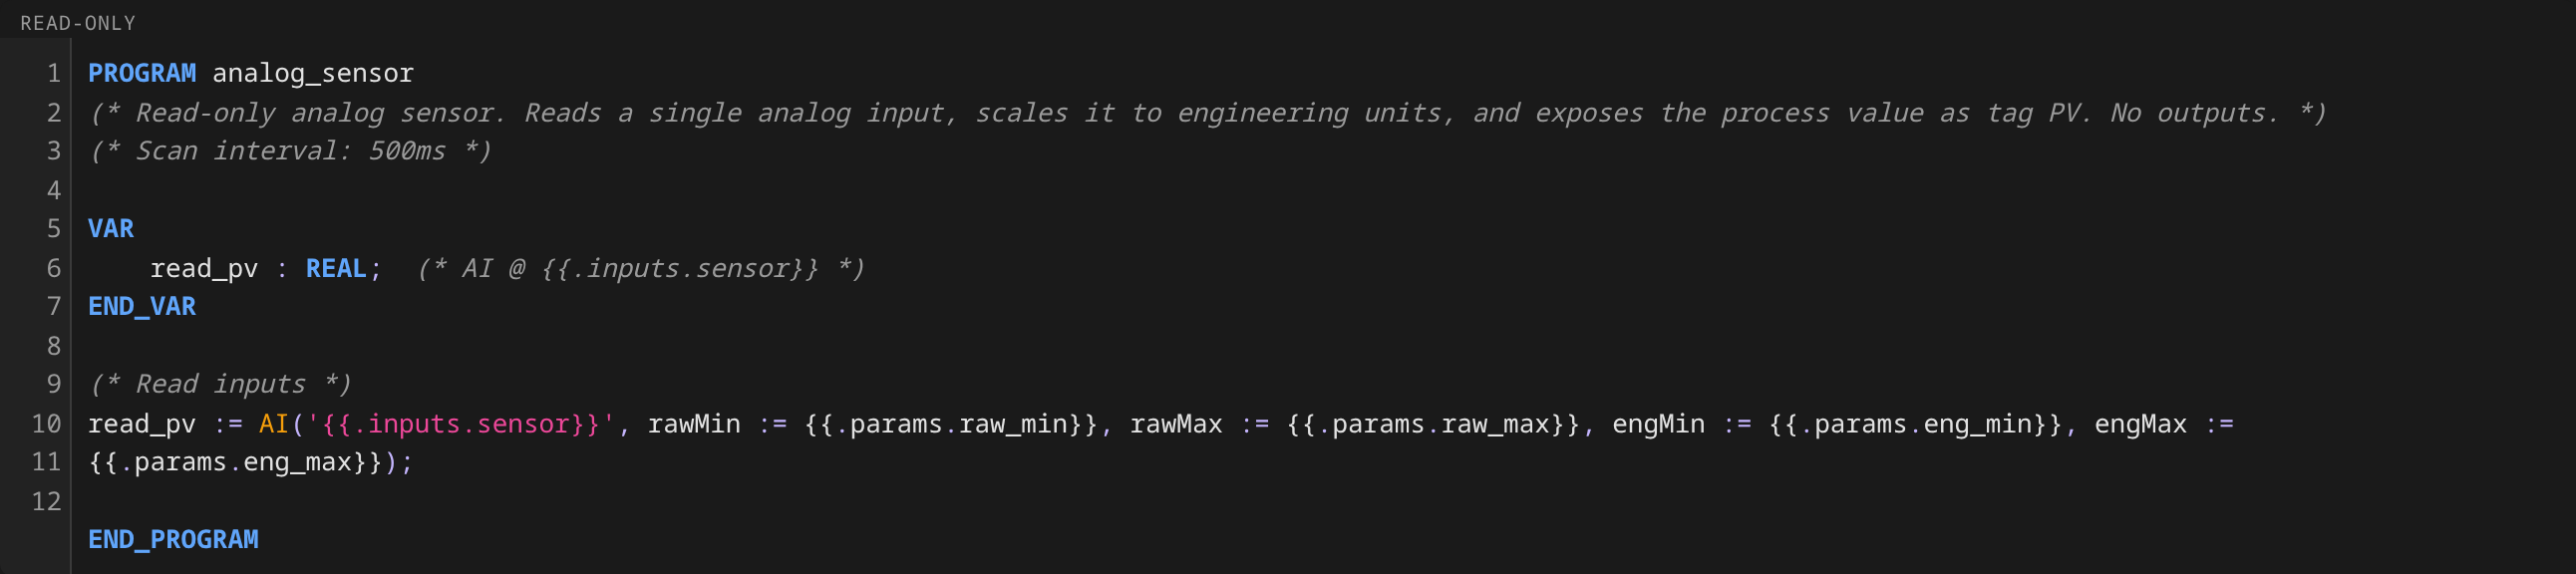
A read-only analog sensor. Reads a single analog input, scales raw
counts to engineering units, and exposes the result as the PV tag. No
outputs. Use this template for temperature, pressure, level, weight, pH,
conductivity, moisture, and flow measurements: anything the control
system reads but never writes.
Where to find it
System endpoint → Equipment Library → Control Modules tab → select analog-sensor.

What you see on the faceplate
Clicking an analog-sensor instance on the unit detail view opens a faceplate with:
| Element | Meaning |
|---|---|
| PV | Measured process value, in engineering units |
| engMin / engMax | Scale range (used for trend charts and bar graphs) |
The faceplate has no command buttons. This template is read-only.
Tags
The template declares deviceClass: sensor
(ADR 0016), the HMI
rendering category. The category is declared, and the HMI never infers
it from moduleType. PV carries
role: feedback. A sensor declares no role: state tag, so the
feedback value is the card's prominent value.
| Tag | Type | Access | Role | Description |
|---|---|---|---|---|
PV |
Float | read | feedback |
Measured process value. The runtime updates it each scan from the scaled AI block. |
Parameters
| Parameter | What it does |
|---|---|
raw_min / raw_max |
Input scaling range in raw counts (e.g. 4000-20000 for 4-20 mA) |
eng_min / eng_max |
Output range in engineering units (e.g. 0-150 °C) |
eng_units |
Display units (°C, bar, %, kg, pH, µS/cm, etc.) |
The scan interval is fixed at 500 ms.
An empty channel
An instance whose sensor is not there yet, a spare channel or a
calibrator port, declares it with unconnectedInputs on the
ControlModule. The block then holds and raises PV_BAD on a Bad
reading without faulting, the PV tag reads Bad while the channel is
empty, and a reading that arrives Good is published normally. See
Control Modules.
How it works
Each scan, the runtime reads the analog input at the configured address,
linearly interpolates the raw value from [raw_min, raw_max] onto
[eng_min, eng_max], and publishes the result on the PV tag. Trend
charts and bar graphs use eng_min / eng_max for their Y-axis range.
The visible data window plays no part in the scale.
Reference instances
The reference plant uses analog-sensor for every measurement point across
all three units:
| Unit | Measurements |
|---|---|
| reactor-1 | temperature · pressure · level · weight · jacket return temperature · pH |
| mix-tank-1 | level · temperature · headspace pressure · weight · pH · conductivity |
| filter-dryer-1 | cake level · vessel temperature · vessel pressure · filtrate flow · cake moisture · weight |
Try it
- Process → riverbend → pharma-area → sim-cell → reactor-1
- Click the reactor temperature sensor symbol on the unit detail view
- Watch
PVupdate every 500 ms — the IOModule's inline simulation drives the value through realistic process dynamics during a batch run - Open a trend chart with this tag selected. The Y axis will use the sensor's engineering range (e.g. 0-150 °C), and the visible data's min/max plays no part