Equipment Operation
The HMI endpoint (/hmi) is the operator-facing workspace for live process
monitoring, faceplate control, and batch execution. This guide covers the
day-to-day operator tasks performed inside HMI: navigating the physical
hierarchy, commanding equipment, switching modes, and responding to alarms.
For the batch-level workflow (starting batches, monitoring procedures, completing runs) see Batch Execution. For the alarm lifecycle and acknowledgment rules see Alarm Management.
/hmi operator surface: the plant overview, a live unit display and faceplate, the alarm summary, the running batch's procedure, the live-feed freshness readout, and the faceplate's Trend link into the Data endpoint's process history.HMI Layout
The HMI sidebar has two sections:
- Navigation — two items: Batch (the Batch Execution view, covered in Batch Execution) and Alarms (the active alarm list, covered in Alarm Management).
- Sites — full ISA-88 physical hierarchy tree (Site → Area → ProcessCell → Unit → ControlModule). This tree is the entry point to the Process view: picking any hierarchy node renders that level's process display in the main pane. Sites are expandable nodes that lazy-load their children on first expand. Clicking a ControlModule navigates to its parent unit and auto-opens its faceplate.
Process View
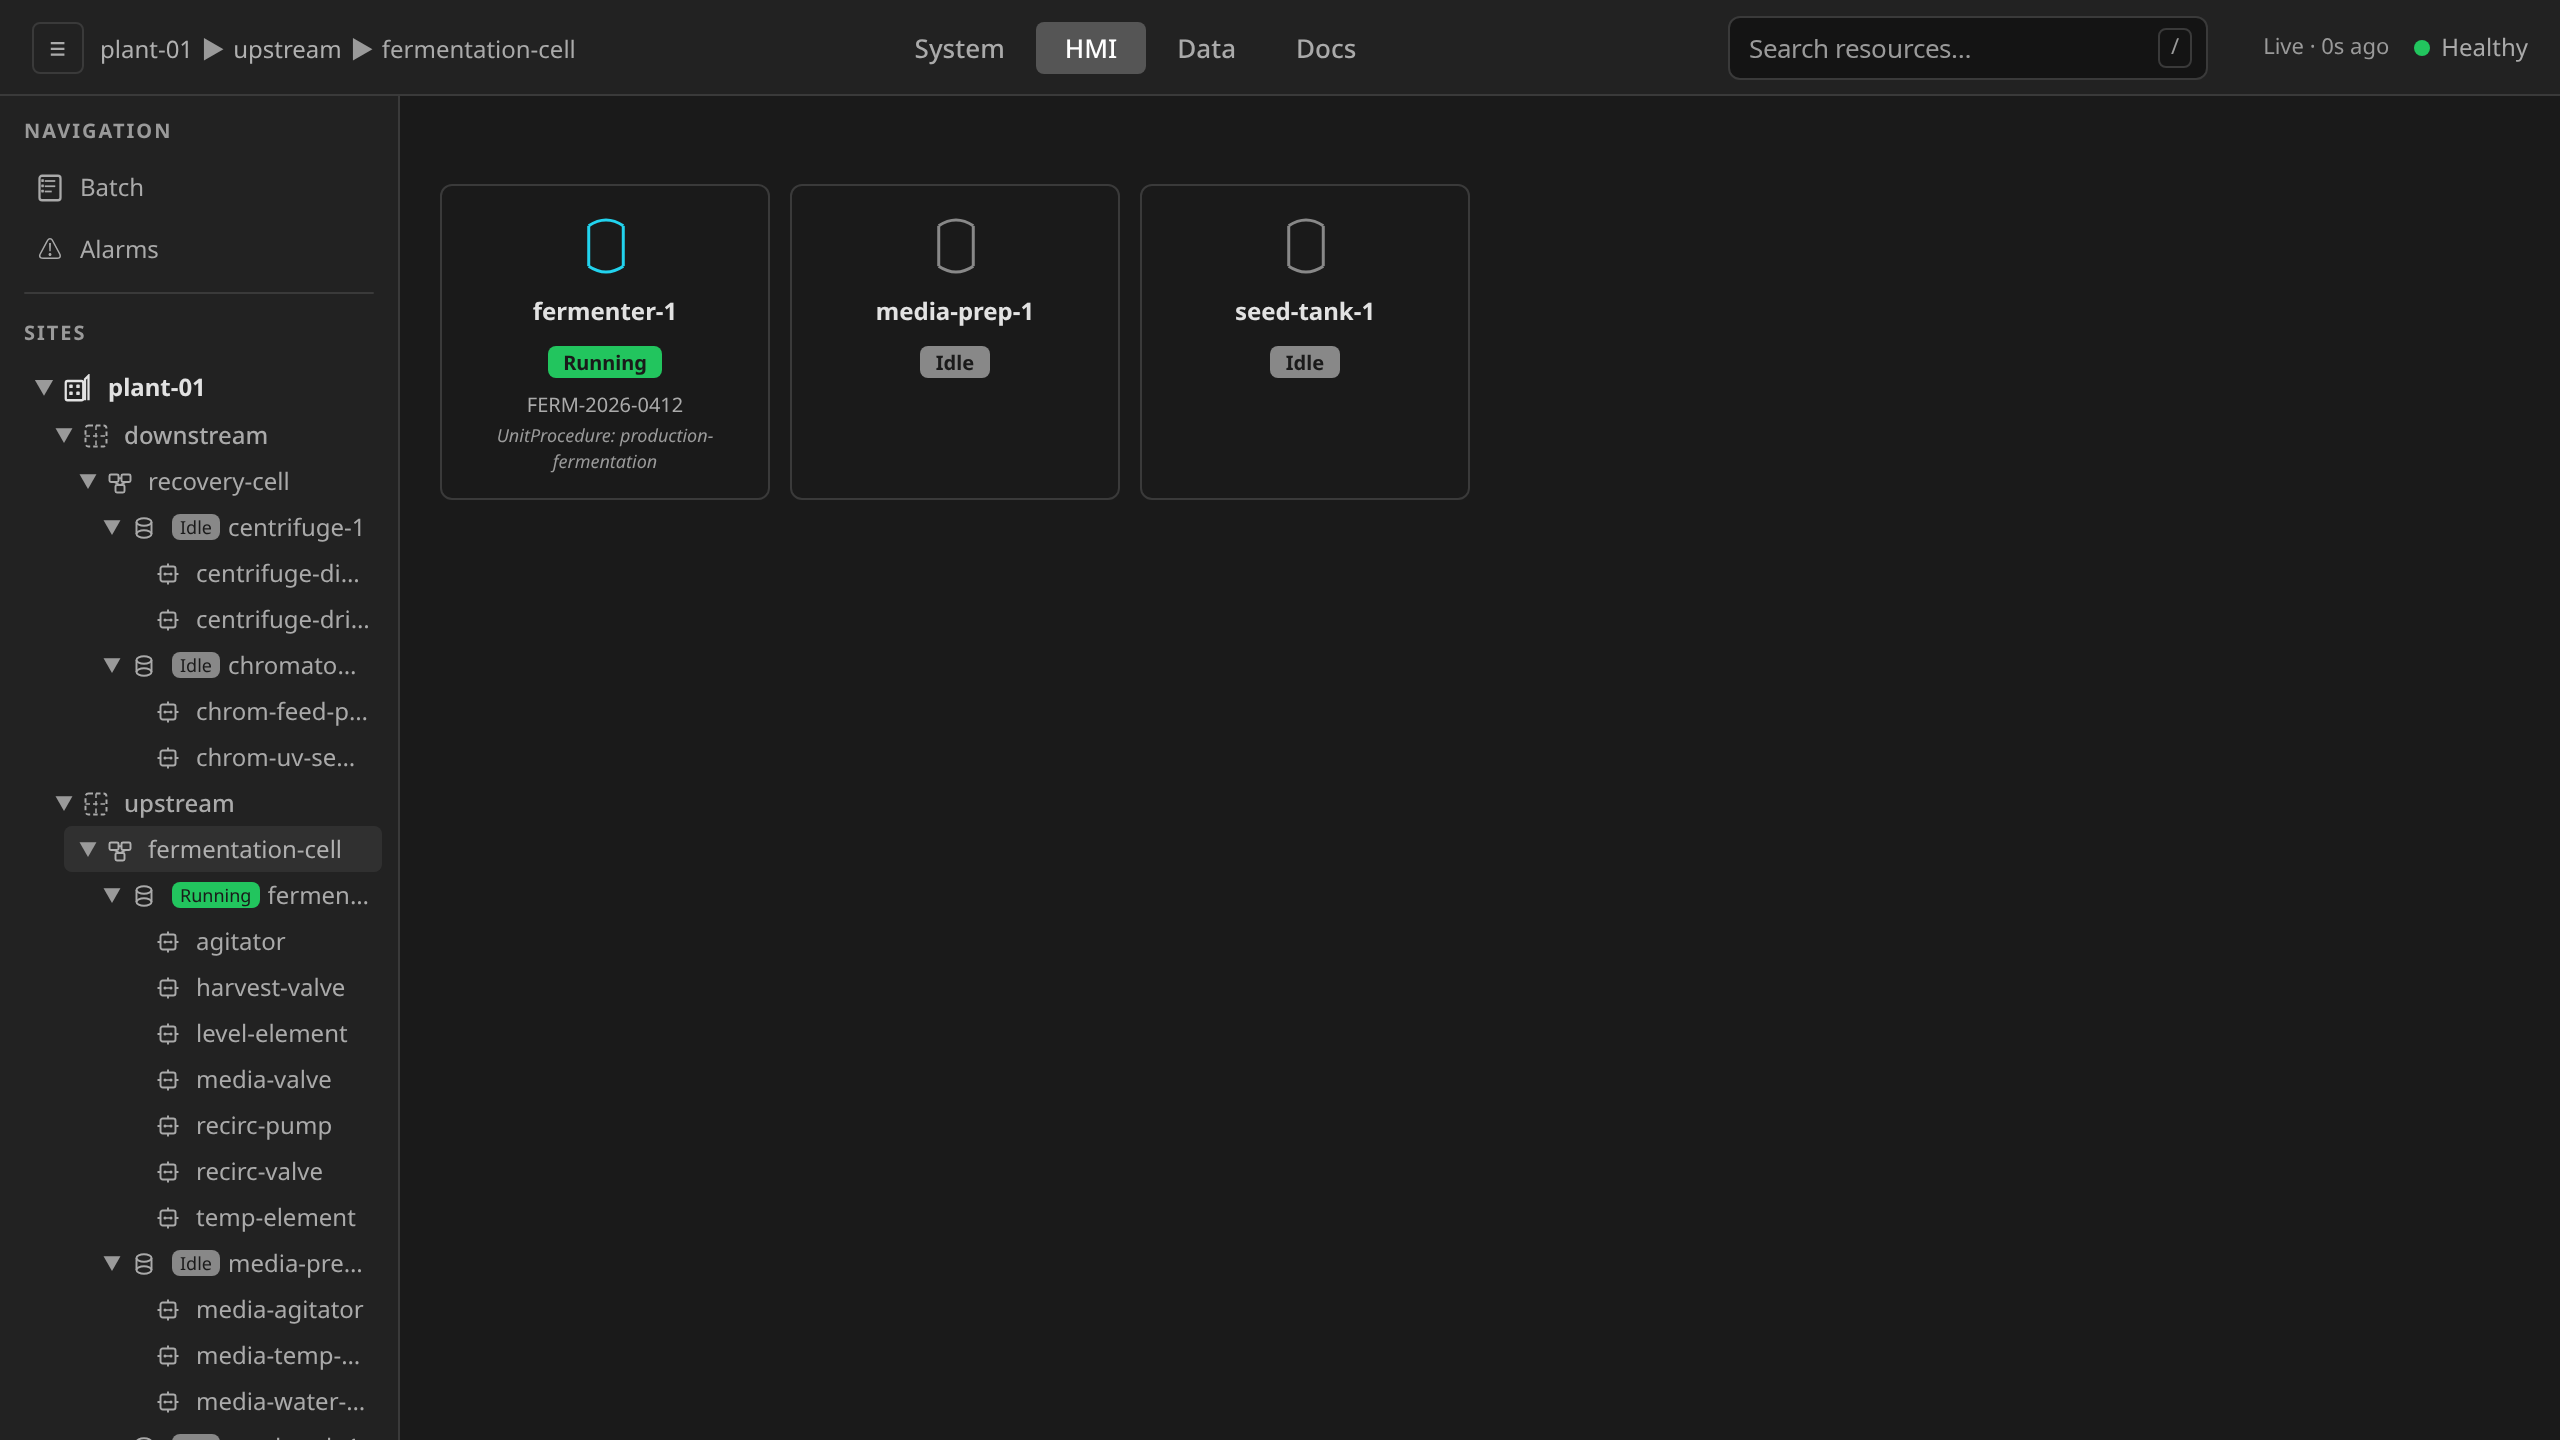
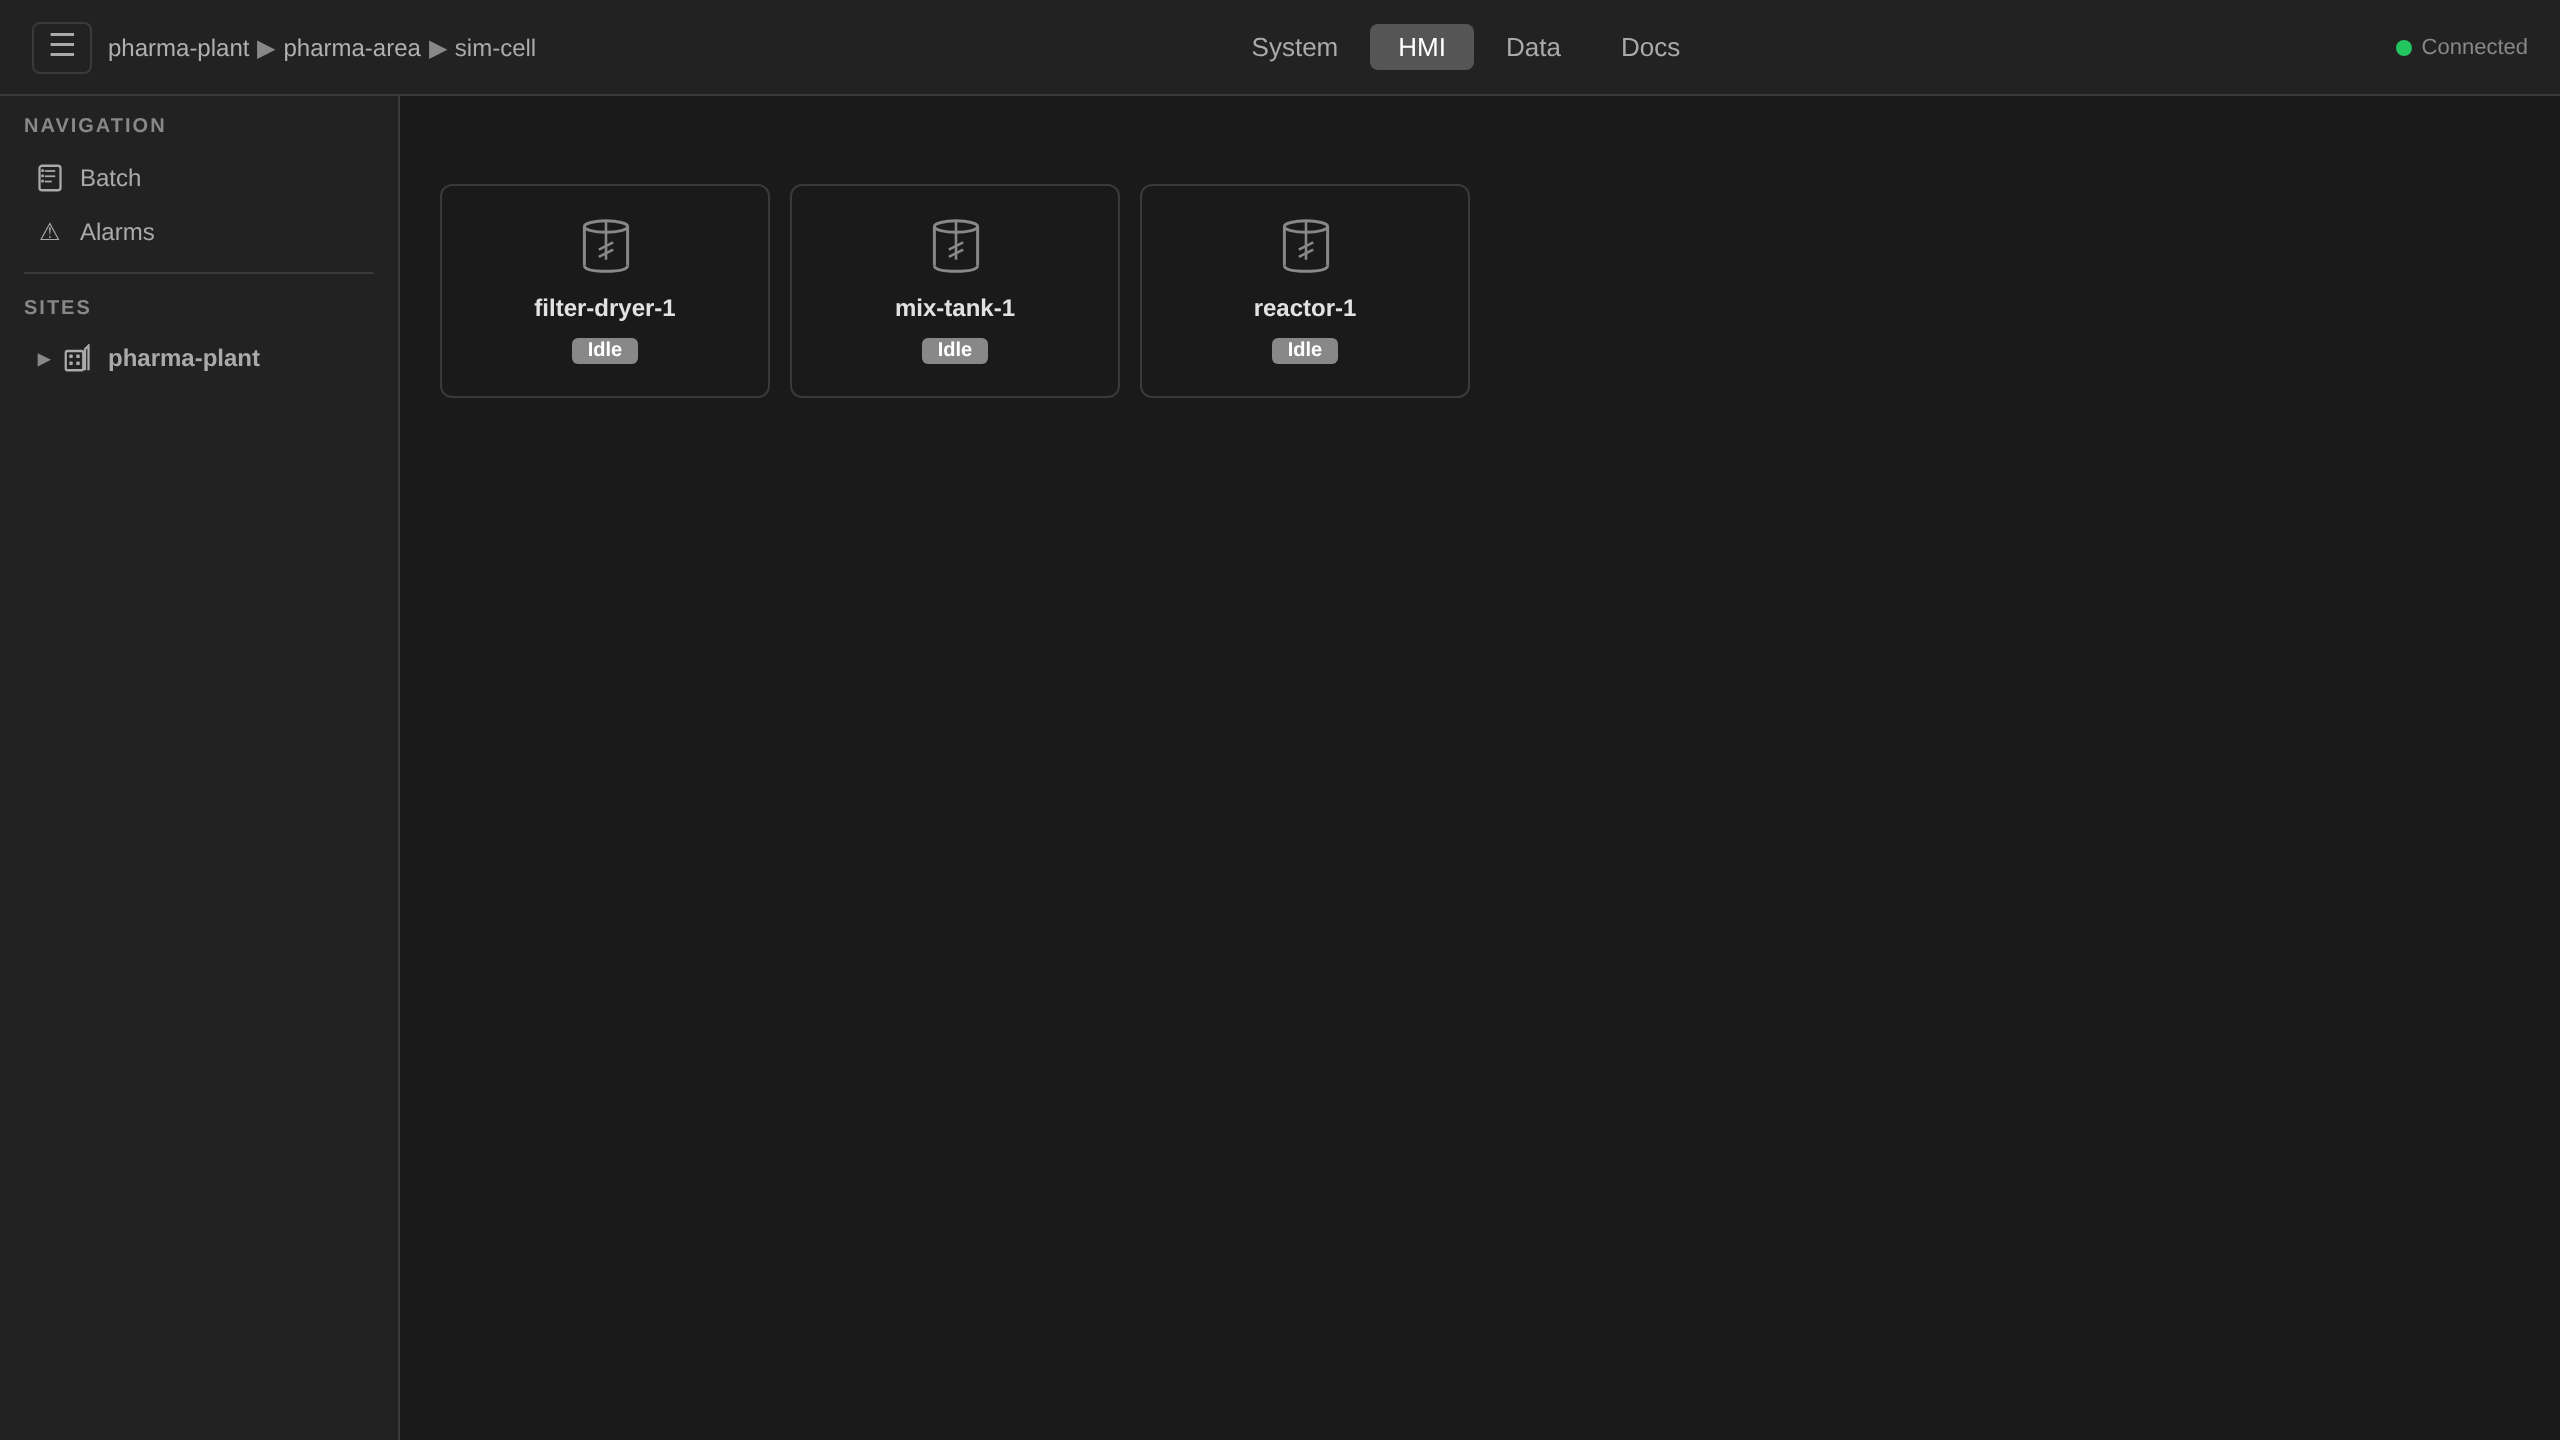
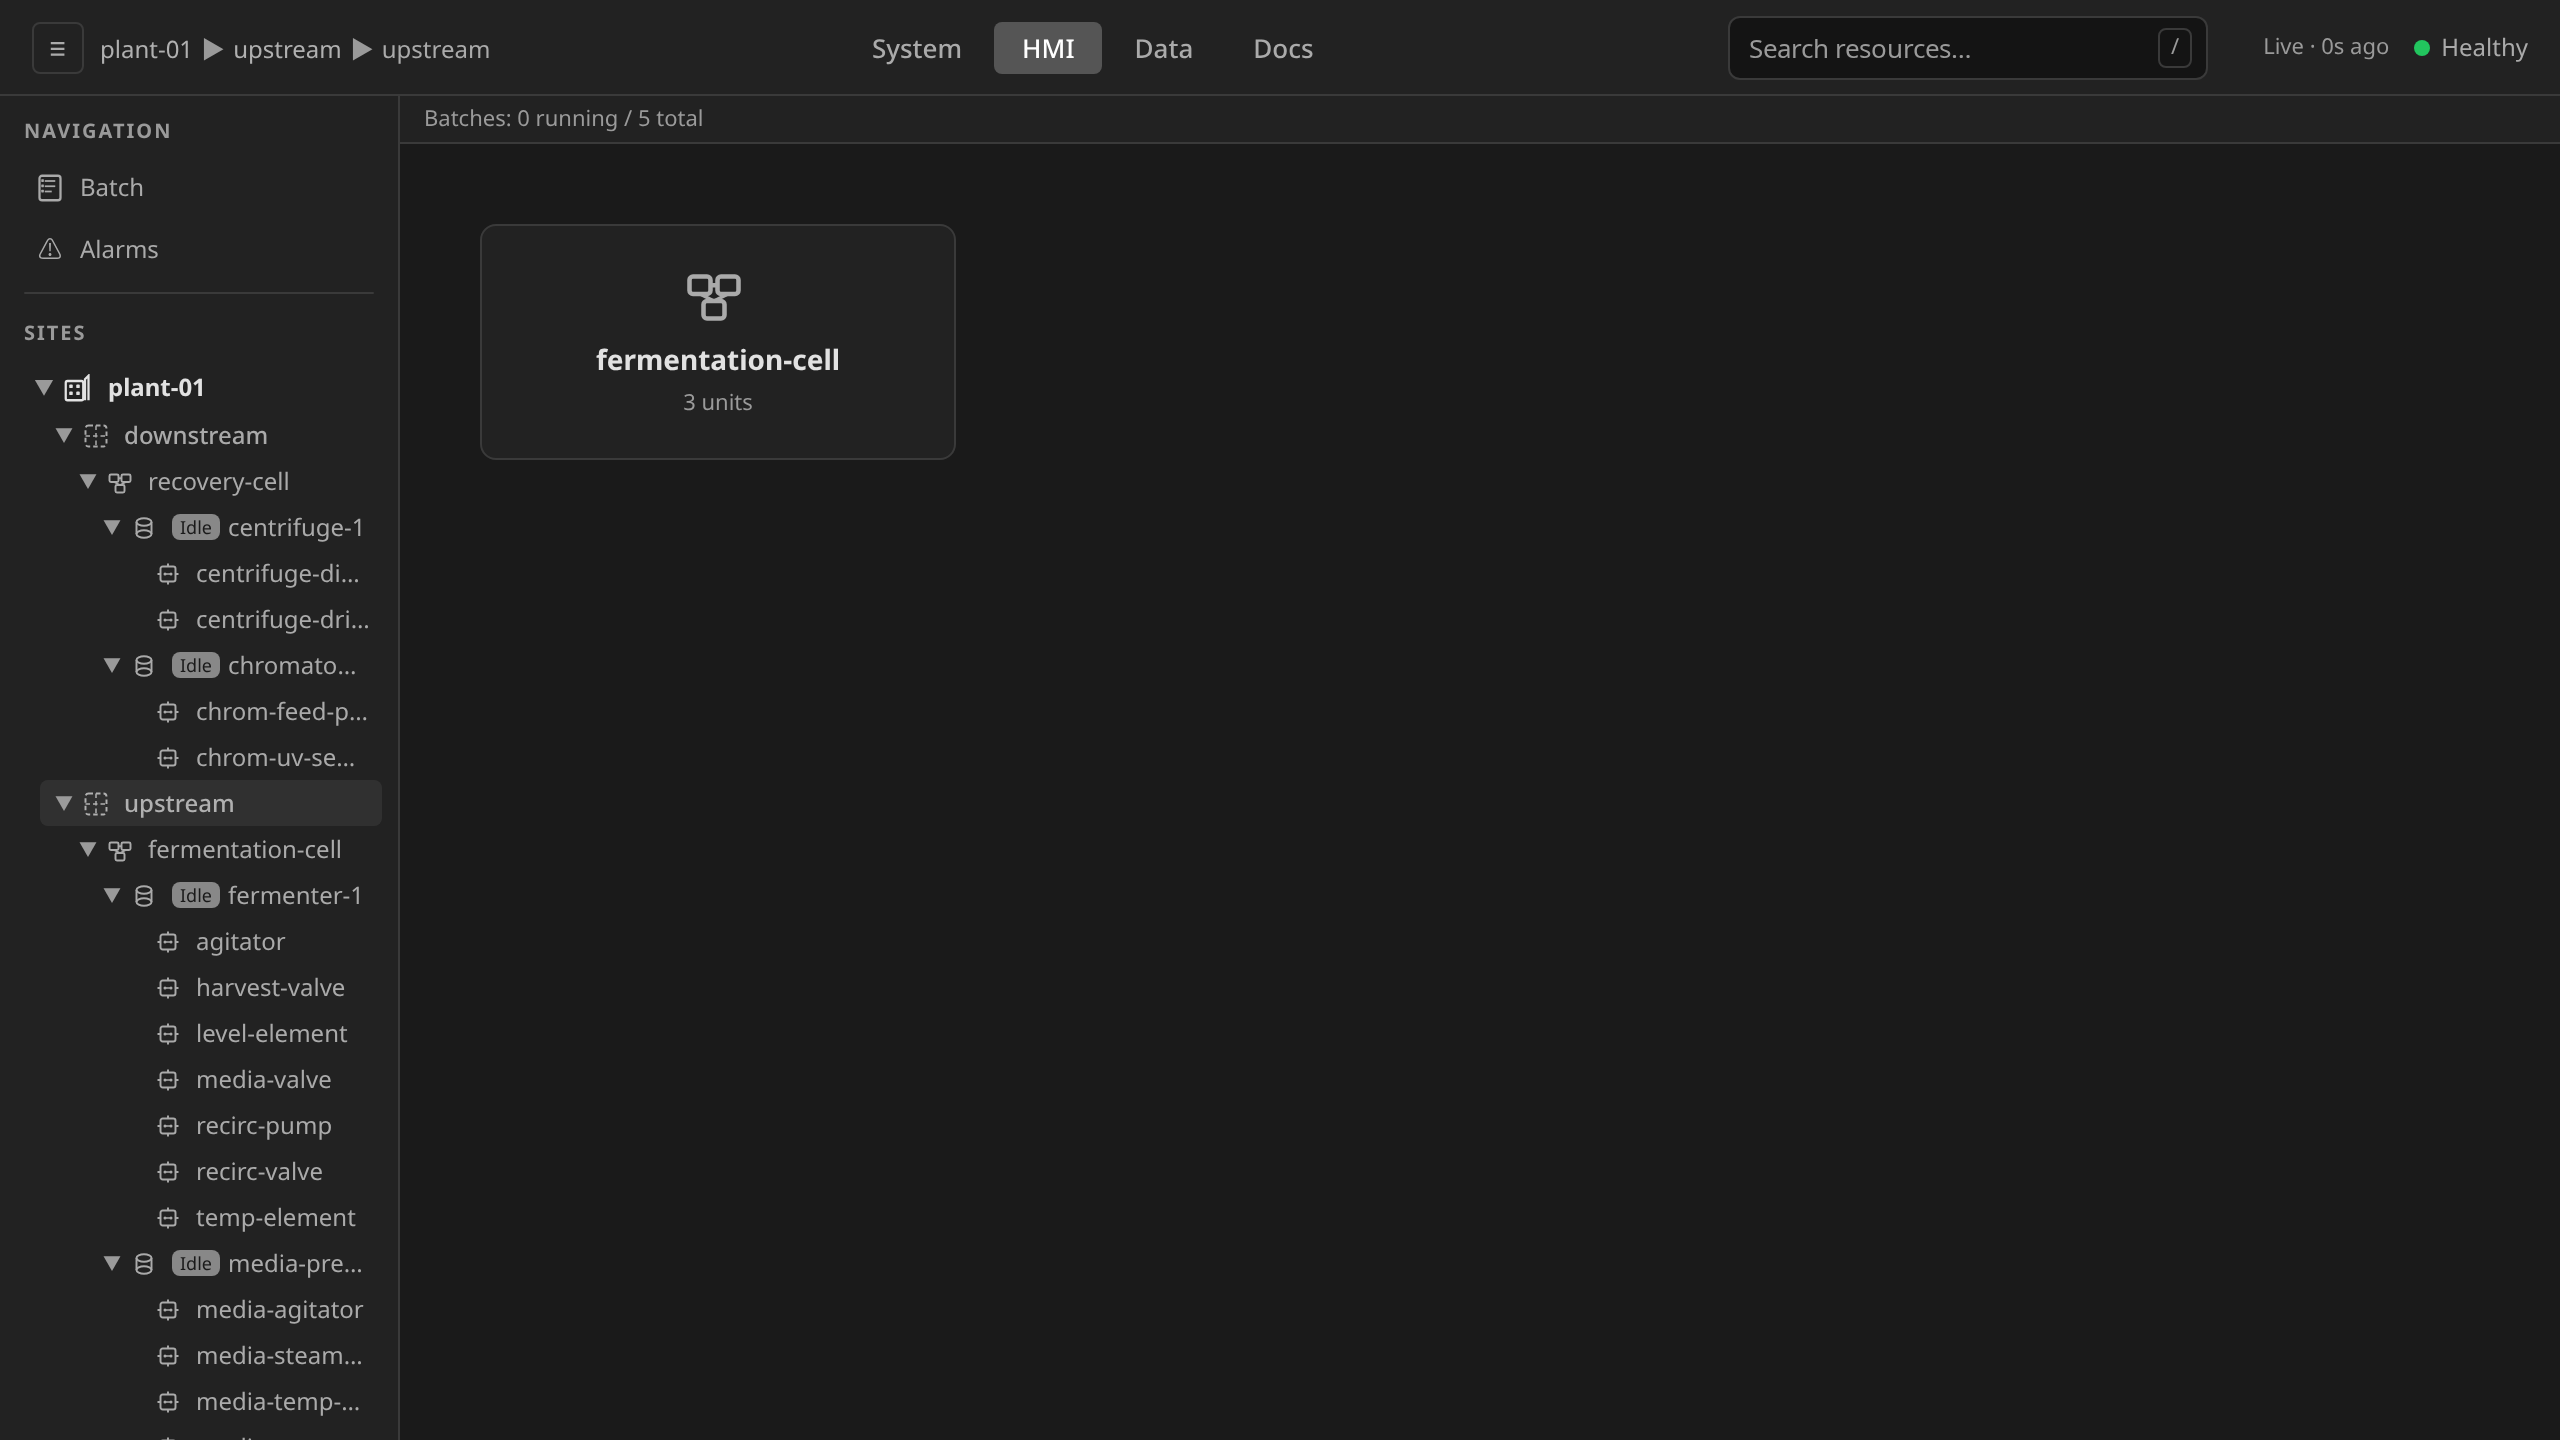
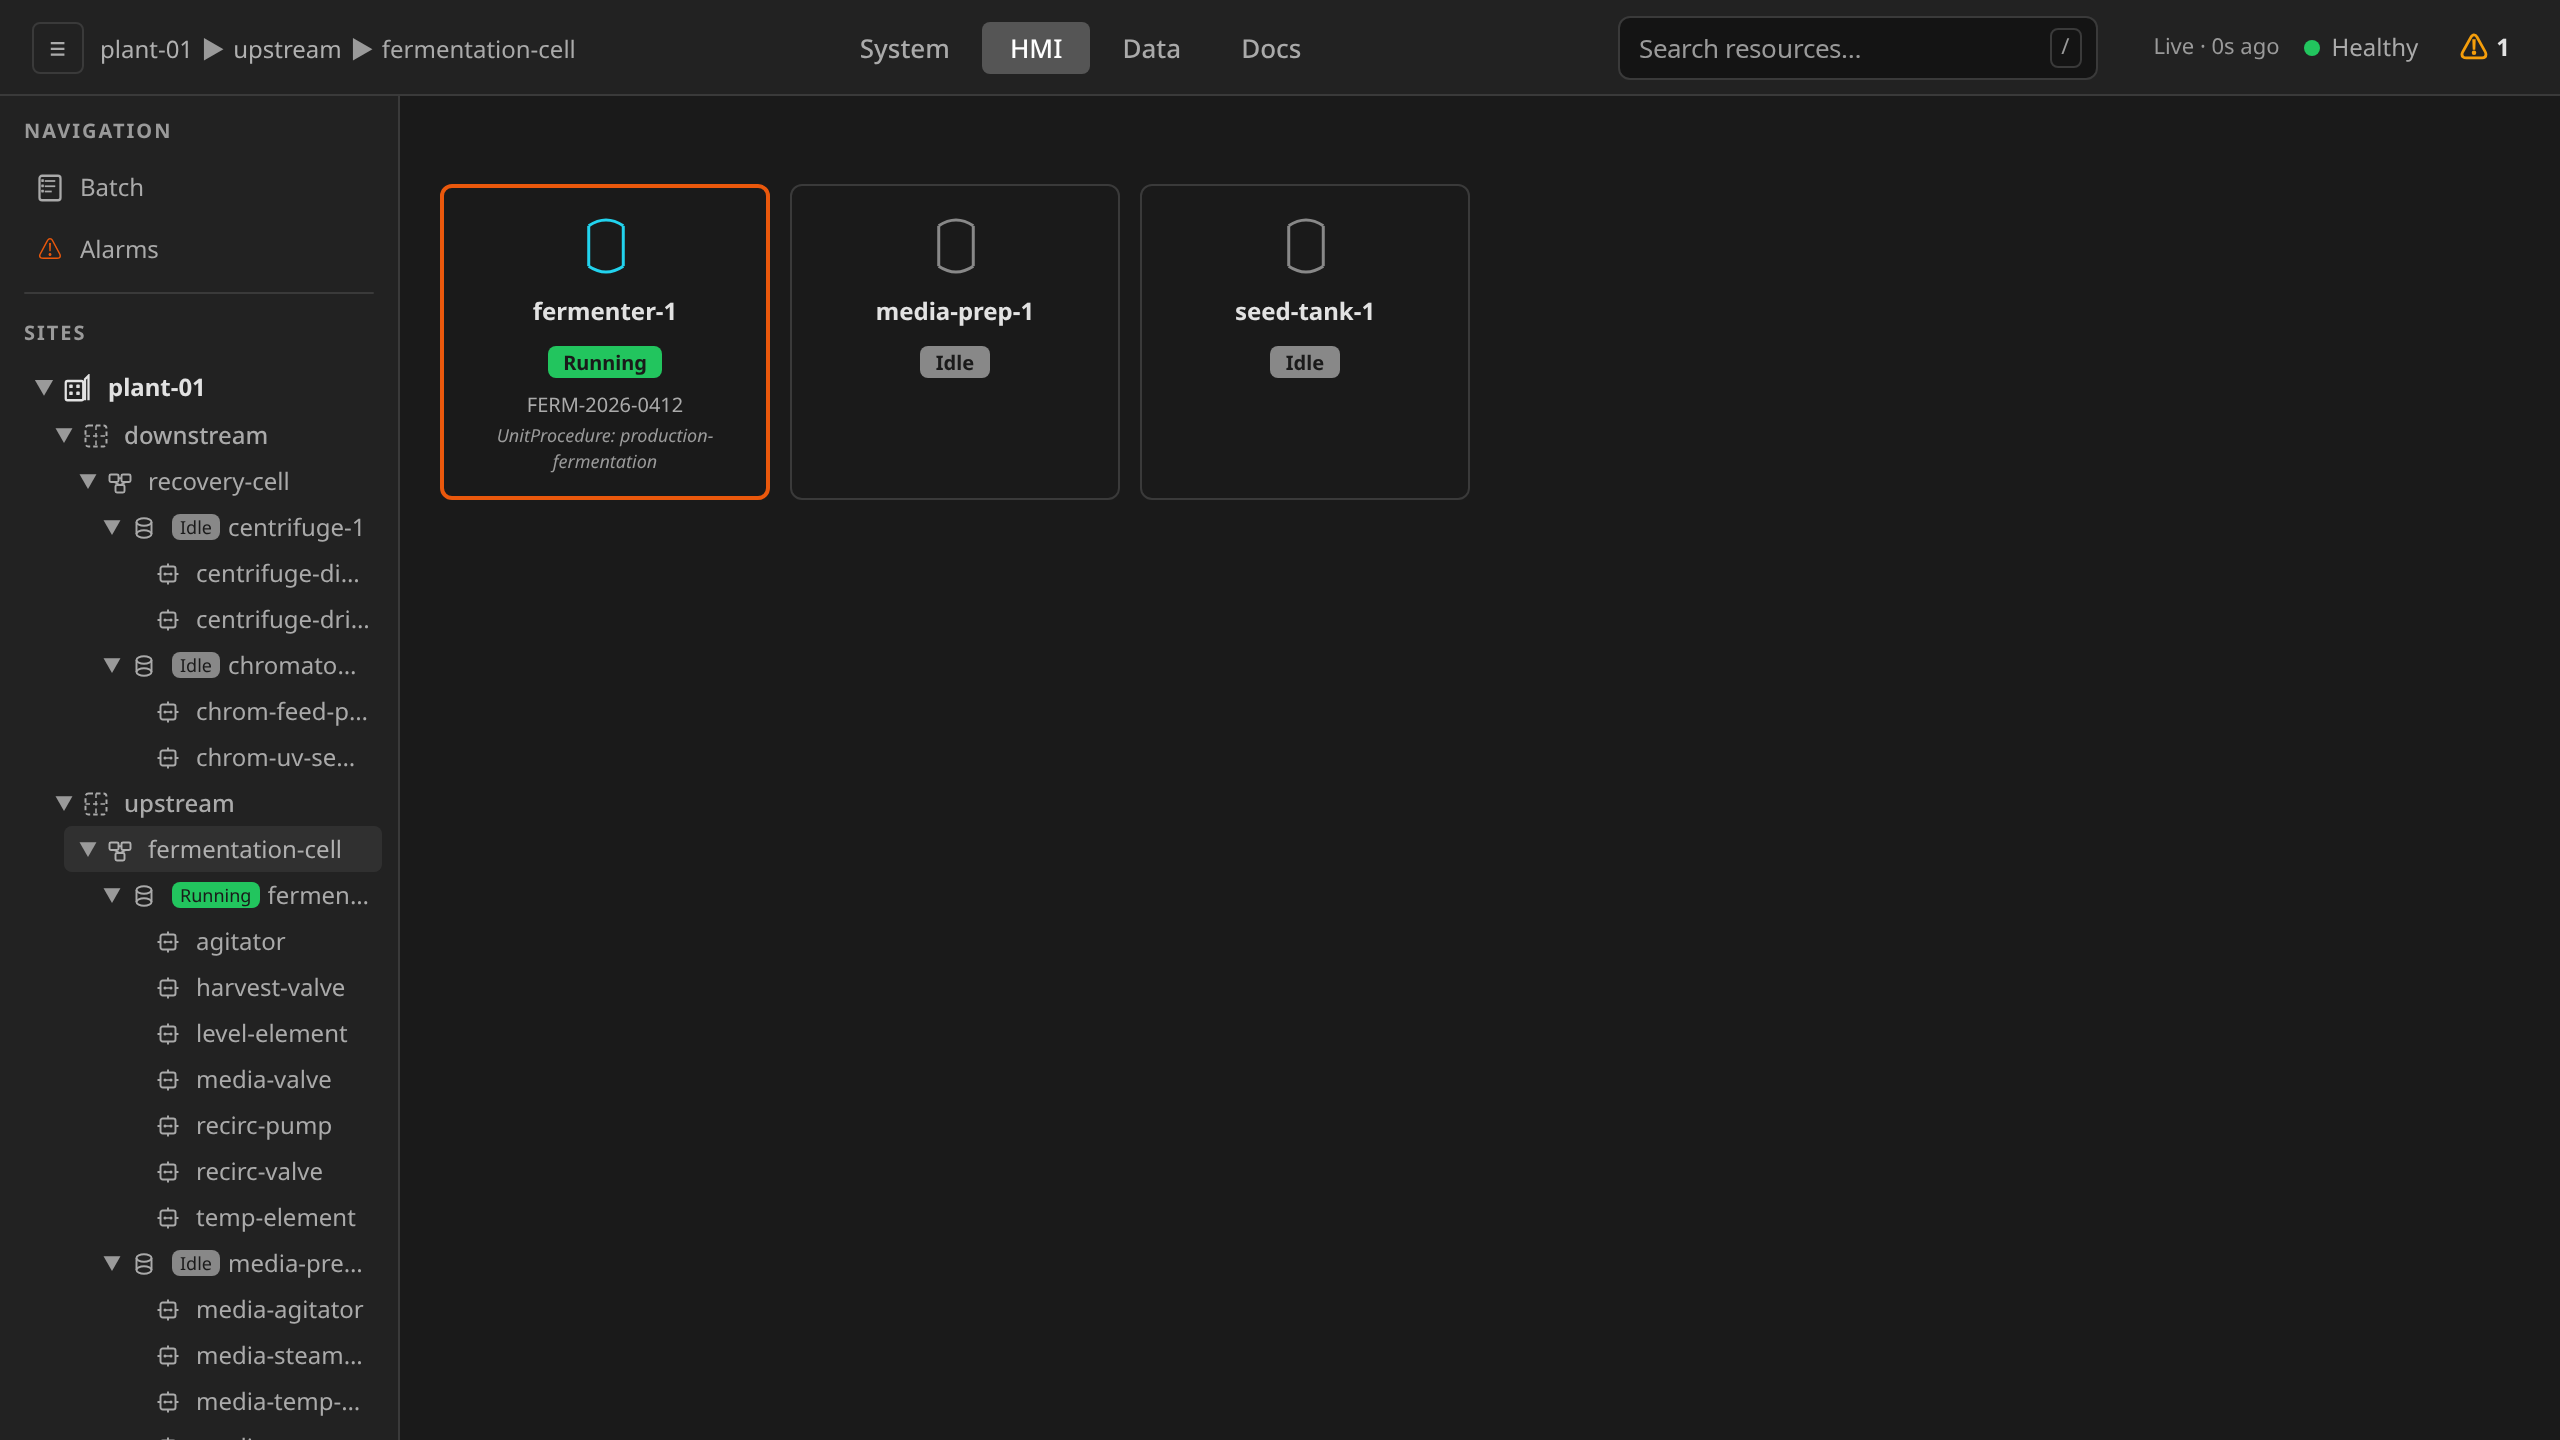
The Process view is the default HMI landing page. It provides drill-down navigation through the ISA-88 physical hierarchy. Each level renders cards that drill into the level below. On the initial landing, single-child chains collapse: a site with one area (or an area with one process cell) auto-drills straight to the first level with something to choose.
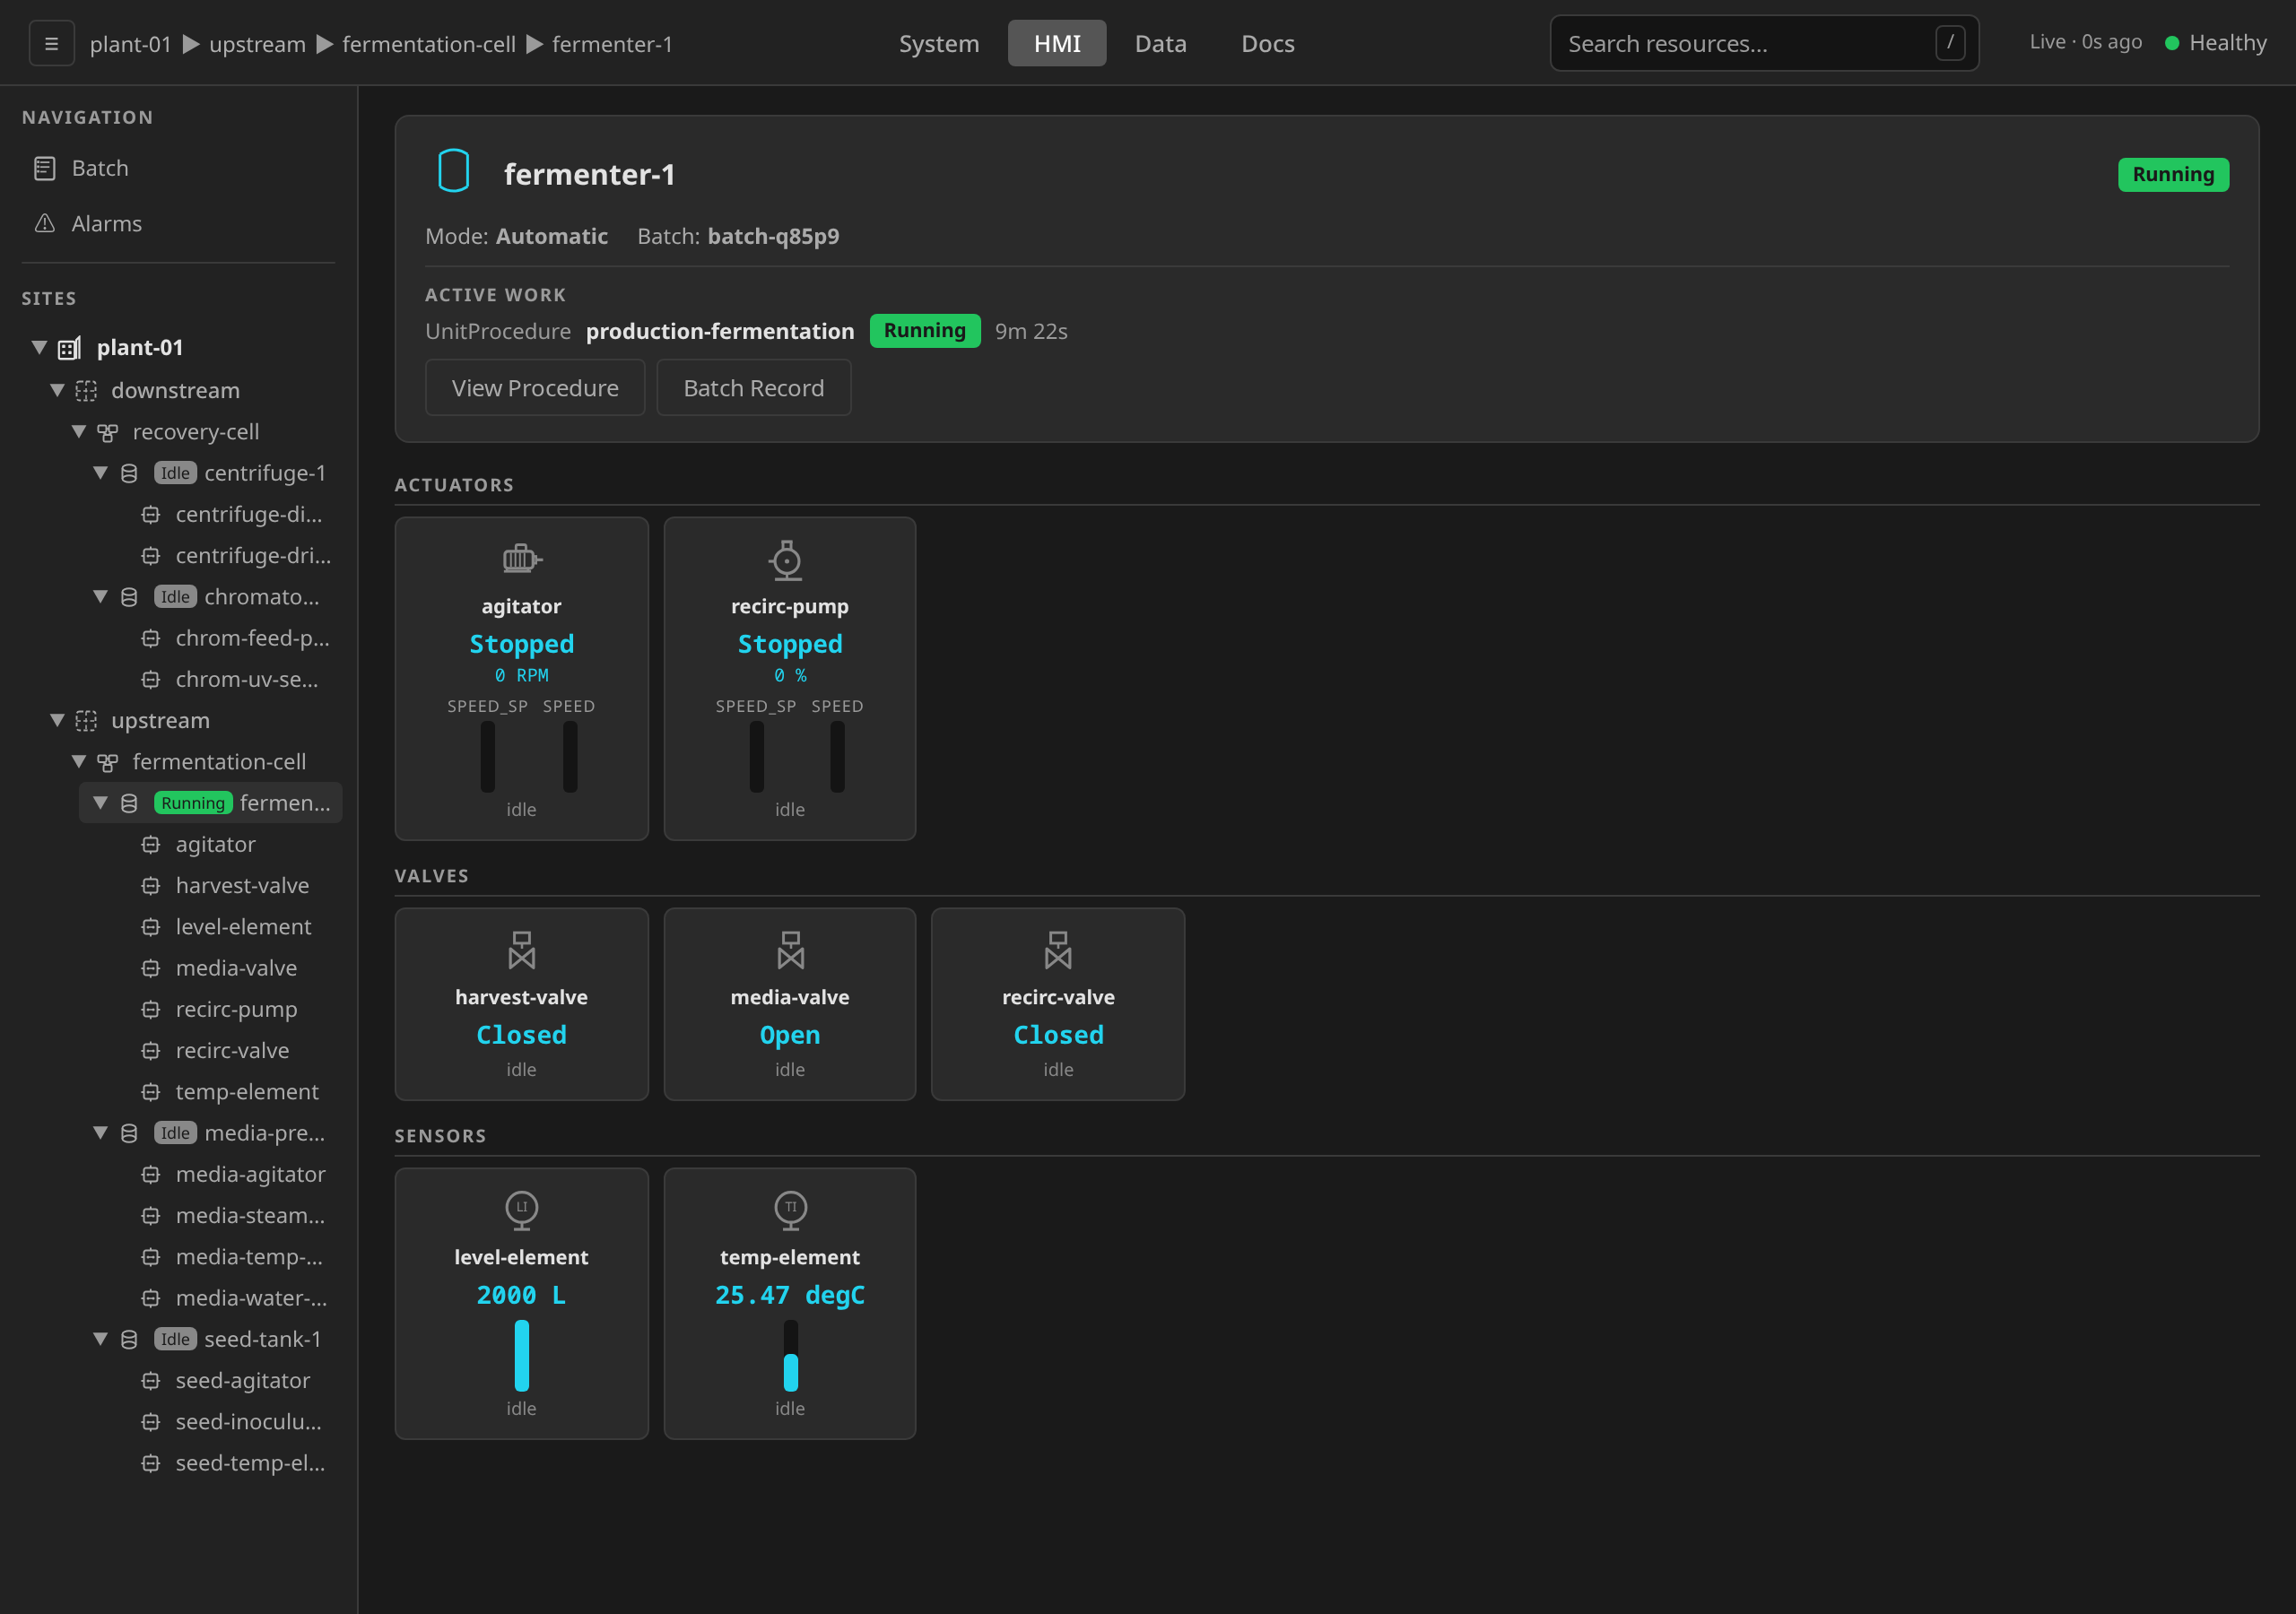
Clicking a ControlModule in the sidebar tree navigates to its parent unit, scrolls to that module's equipment card, and expands its faceplate inline, the same surface a card click opens.
Unit Detail Dashboard
The unit detail dashboard renders the process using ISA 5.1 symbols with live tag values. The dashboard itself is display-only. Control actions live on each ControlModule's faceplate.
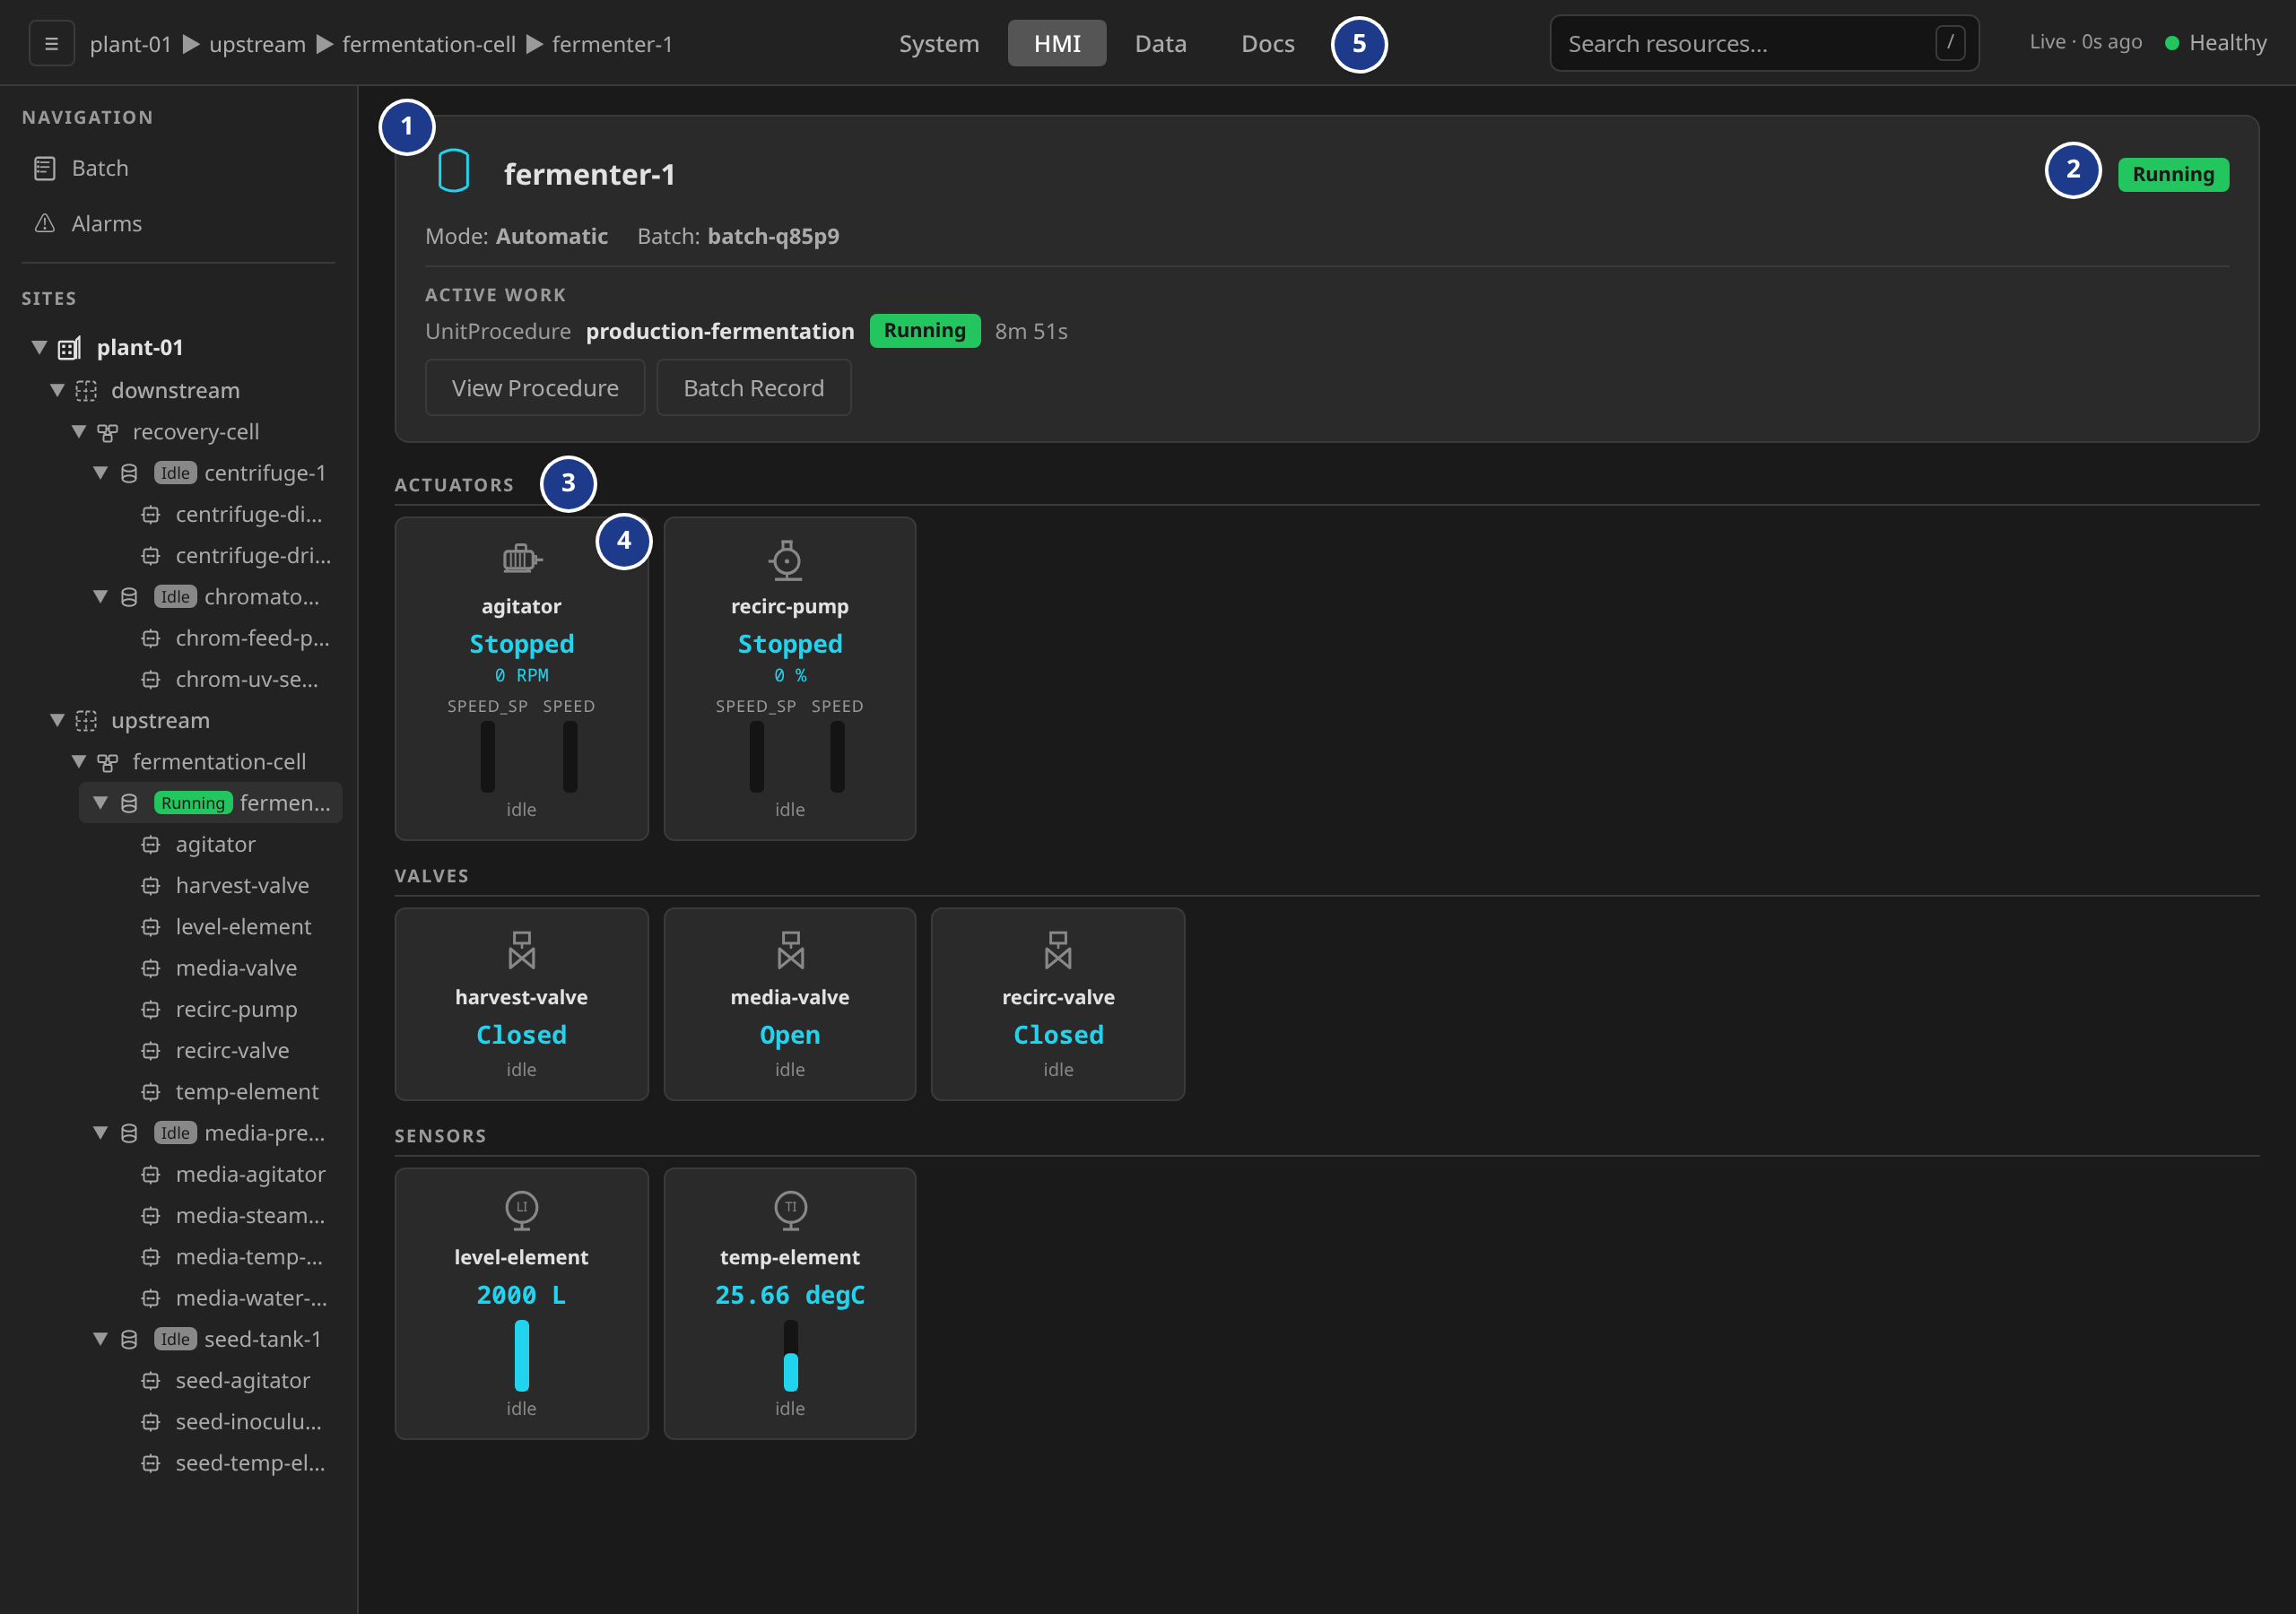
- Unit header — equipment symbol, name, mode (read-only on the unit itself, while the toggle lives on each ControlModule's faceplate), and an Active Work block with View Procedure / Batch Record shortcuts when the unit is allocated to a running batch.
- ISA-88 state pill — current state of the unit. Idle when no batch is allocated, and otherwise it reflects the running phase.
- ISA 5.1 category sections — equipment cards are grouped into
Actuators, Valves, Sensors, and Controllers by the
deviceClasseach template declares (ADR 0016). Modules without one land under Other. - Equipment card — click any card to expand its faceplate inline
(state, mode toggle, writable controls, tag table). Cards display the
prominent value (the tag declared
role: state, orrole: feedbackwhen no state tag exists) and live bar gauges keyed by tag role. All writes happen in the faceplate. - Cross-endpoint nav — the top bar's alarm badge shows the site-wide active count, and the Alarms sidebar entry turns solid amber on unacked alarms. The faceplate's Trend button opens the Data endpoint's Trends view with the module's tags preselected and plotted (bucketed averages, so the whole window keeps its shape). Trending itself lives in the Data endpoint. The HMI carries only the link.
See Alarm Management for the alarms view and Batch Execution for the procedure viewer and batch record details.
Faceplates
Faceplates are the primary operator control surface for individual equipment. Open a faceplate by clicking an equipment card on the unit dashboard or by selecting a ControlModule in the sidebar tree. Both paths expand the same inline faceplate on the unit dashboard (the sidebar path also navigates to the parent unit and scrolls the card into view). Equipment-level control actions (mode changes, manual setpoints, alarm acknowledgment) are issued from the faceplate. ISA-88 commands are not. They flow through the Batch Execution view (see Batch Execution). Equipment cards on the process view are display-only. Controls live only on the faceplate to prevent accidental presses.
What a faceplate shows
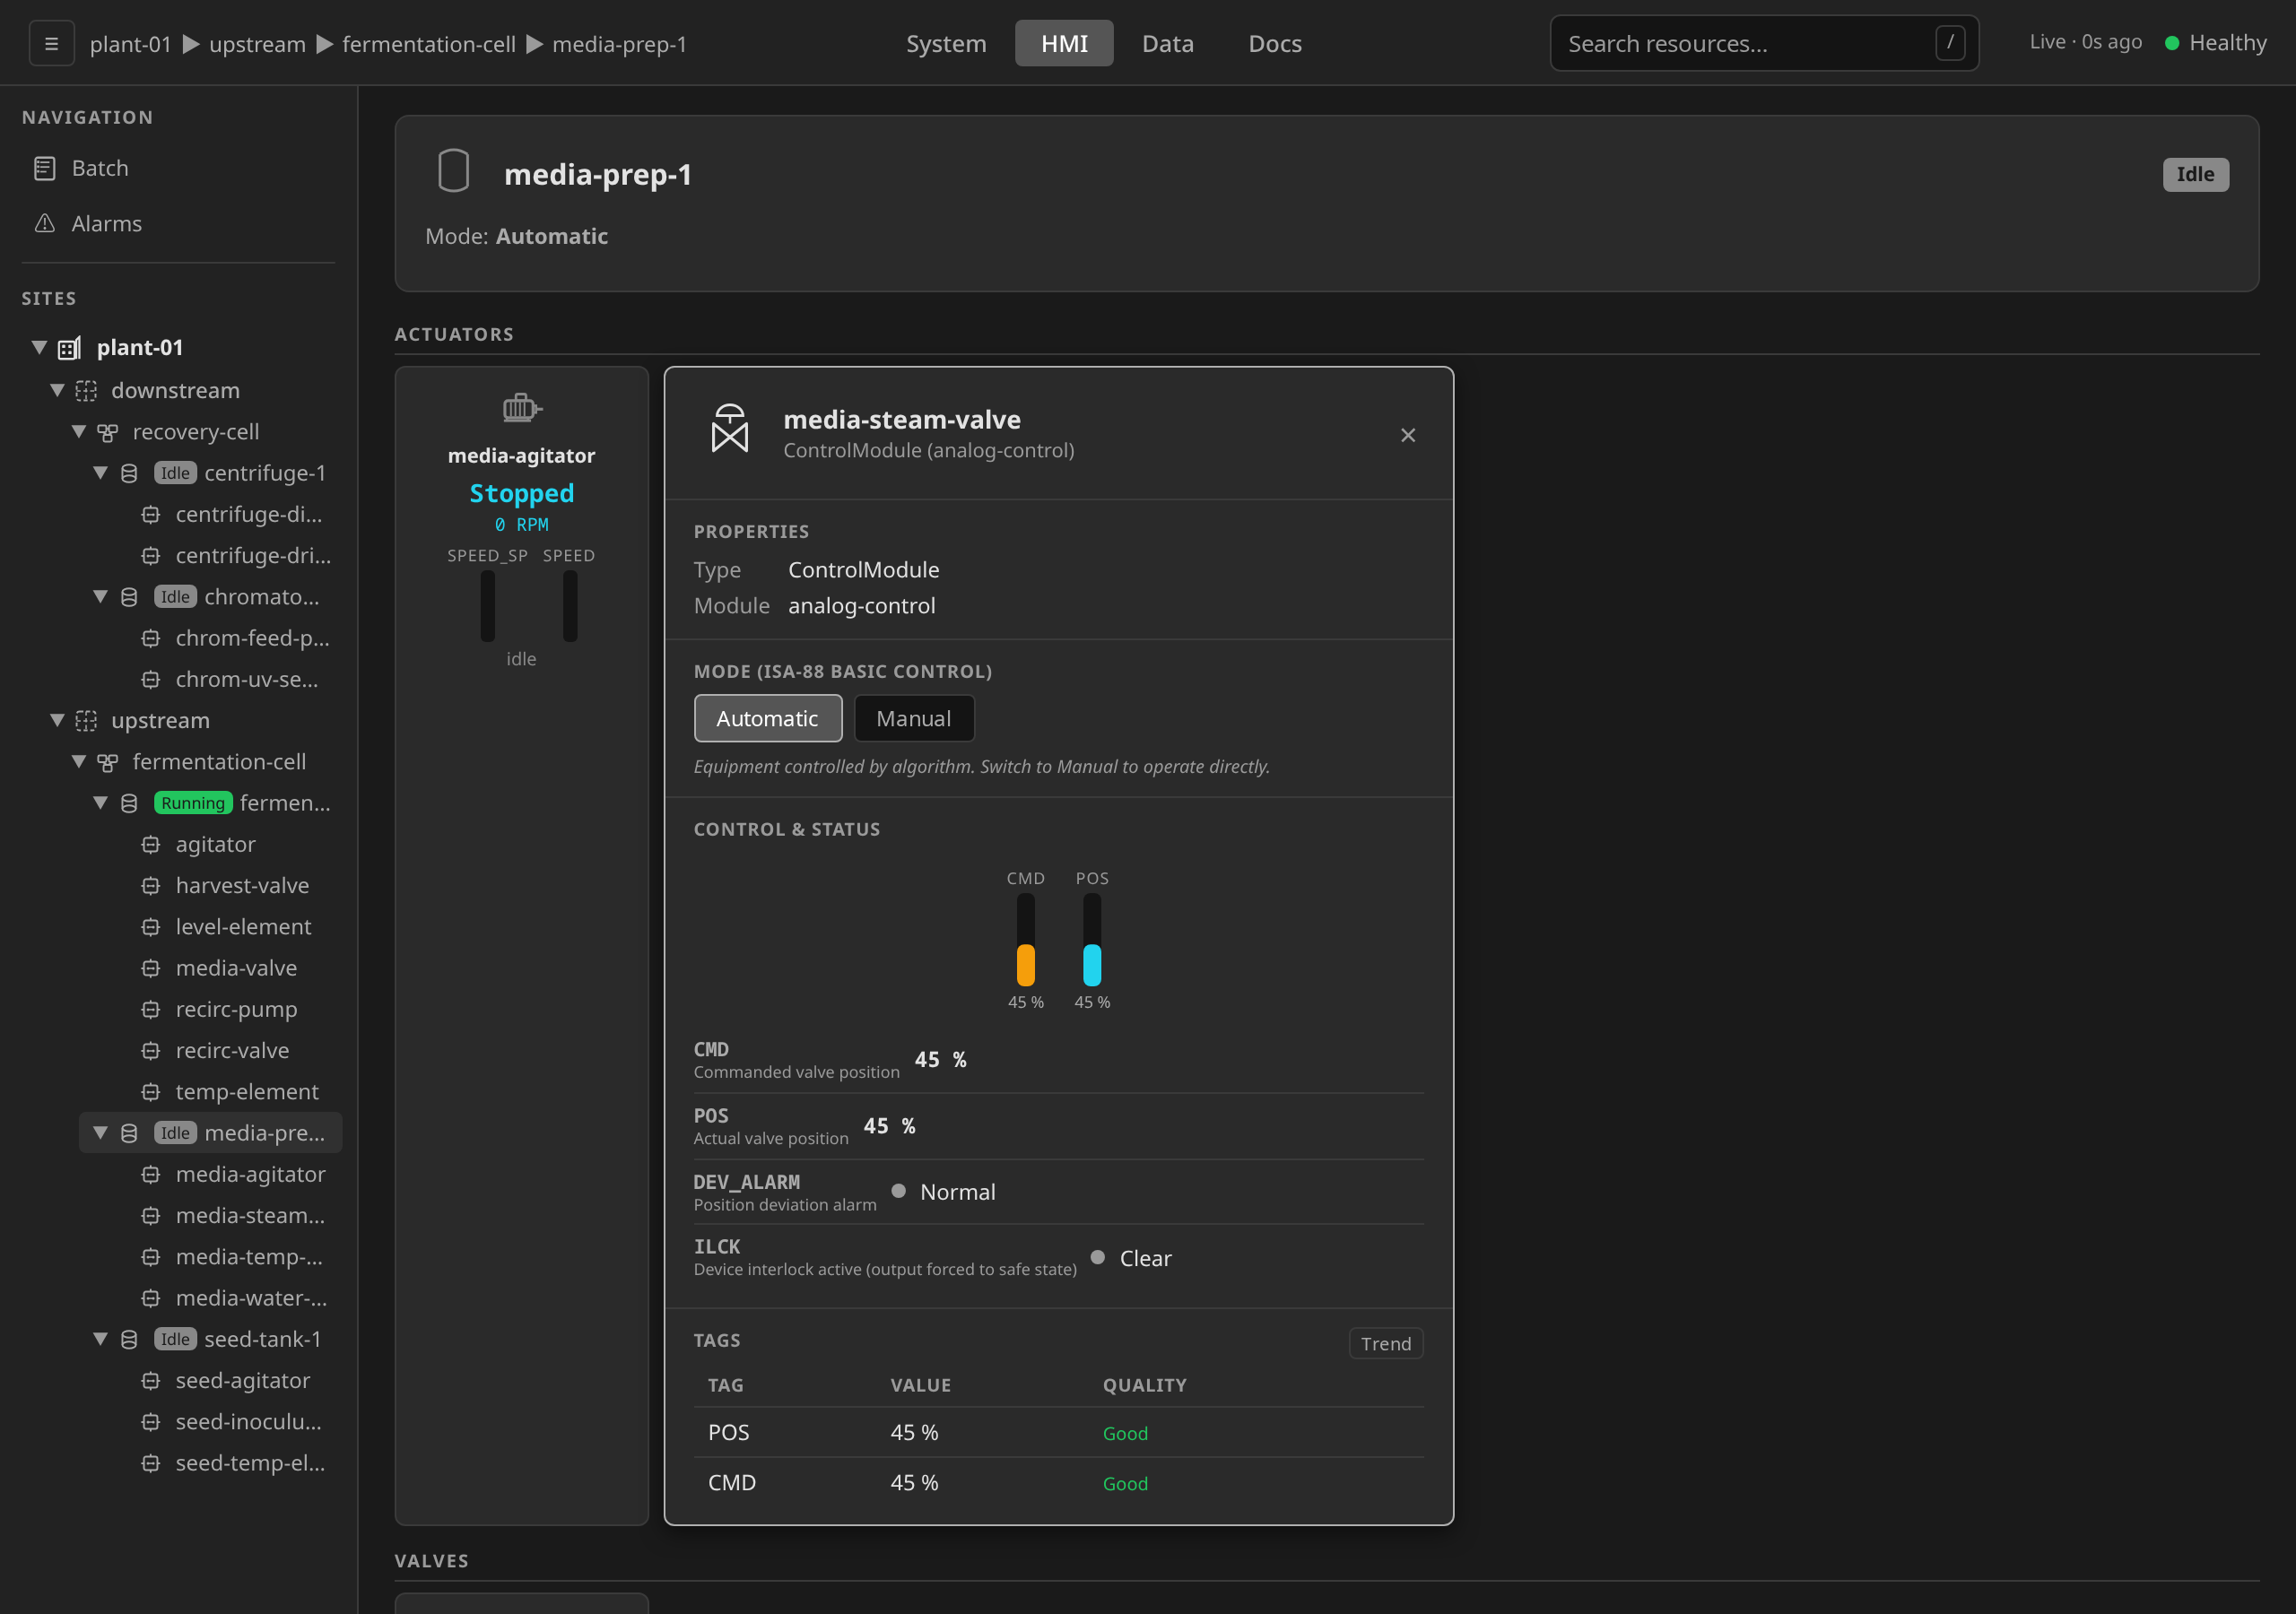
Every faceplate is built from the same five regions, top to bottom:
- Header — equipment symbol, name, kind/module type, and (for ControlModules) a CM-health banner when the FB network is unavailable. Unit faceplates carry an ISA-88 state pill here, and ControlModule faceplates do not. A CM's run-state is a field reading in Control & Status (see CM health banner).
- Properties — kind, module type, and the batch this equipment is allocated to (when allocated).
- Mode — Automatic / Manual toggle (ISA-88 Table 1: in Automatic the control algorithm drives the equipment, and in Manual the operator drives it directly). The mode gates whether write controls are enabled.
- Control & Status (ControlModules only) — dual bar gauges (commanded value vs feedback) and rows of writable / read-only tags.
- Tags — the full tag table with live values, quality indicators, and a Trend button that opens a multi-tag chart.
Faceplate variants
The faceplate is one component that adapts to the module type. The set of visible tags, the bar-gauge legend, and the writable-control widgets change with the CM template.
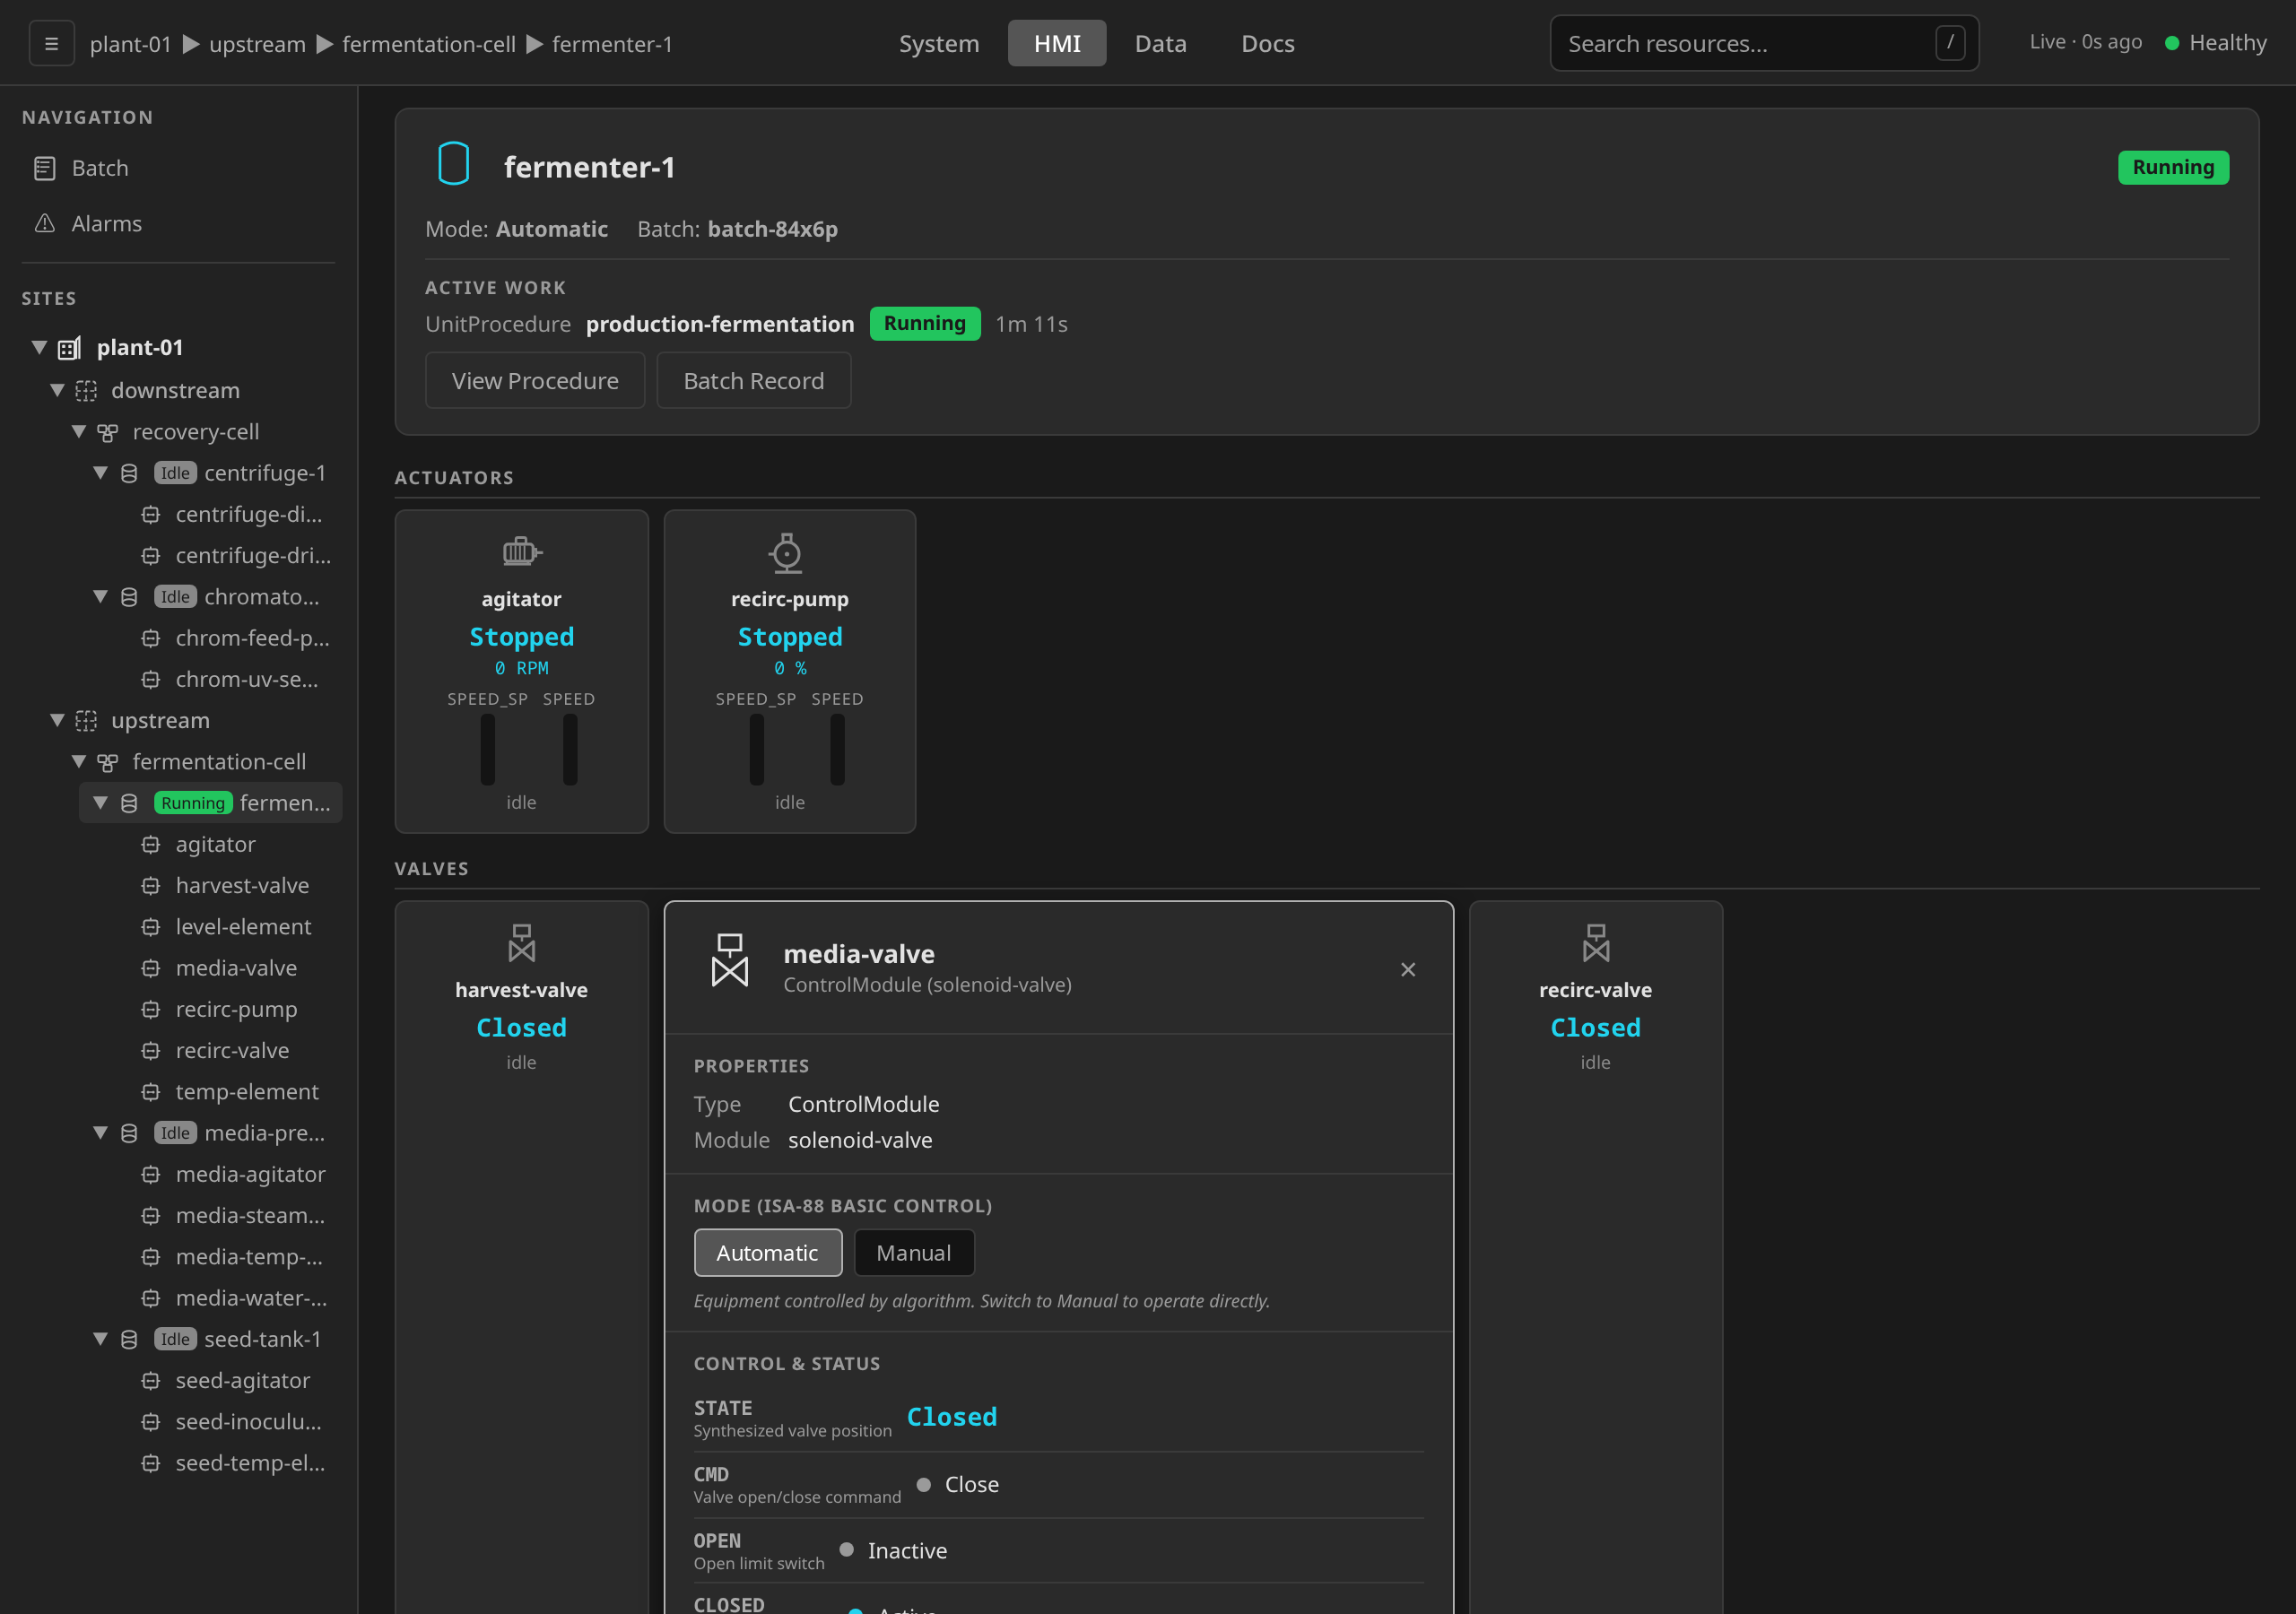
Two-state CMD (Open/Closed), feedback, mismatch alarm. Shown on the
fermenter's media inlet valve, a solenoid-valve instance.
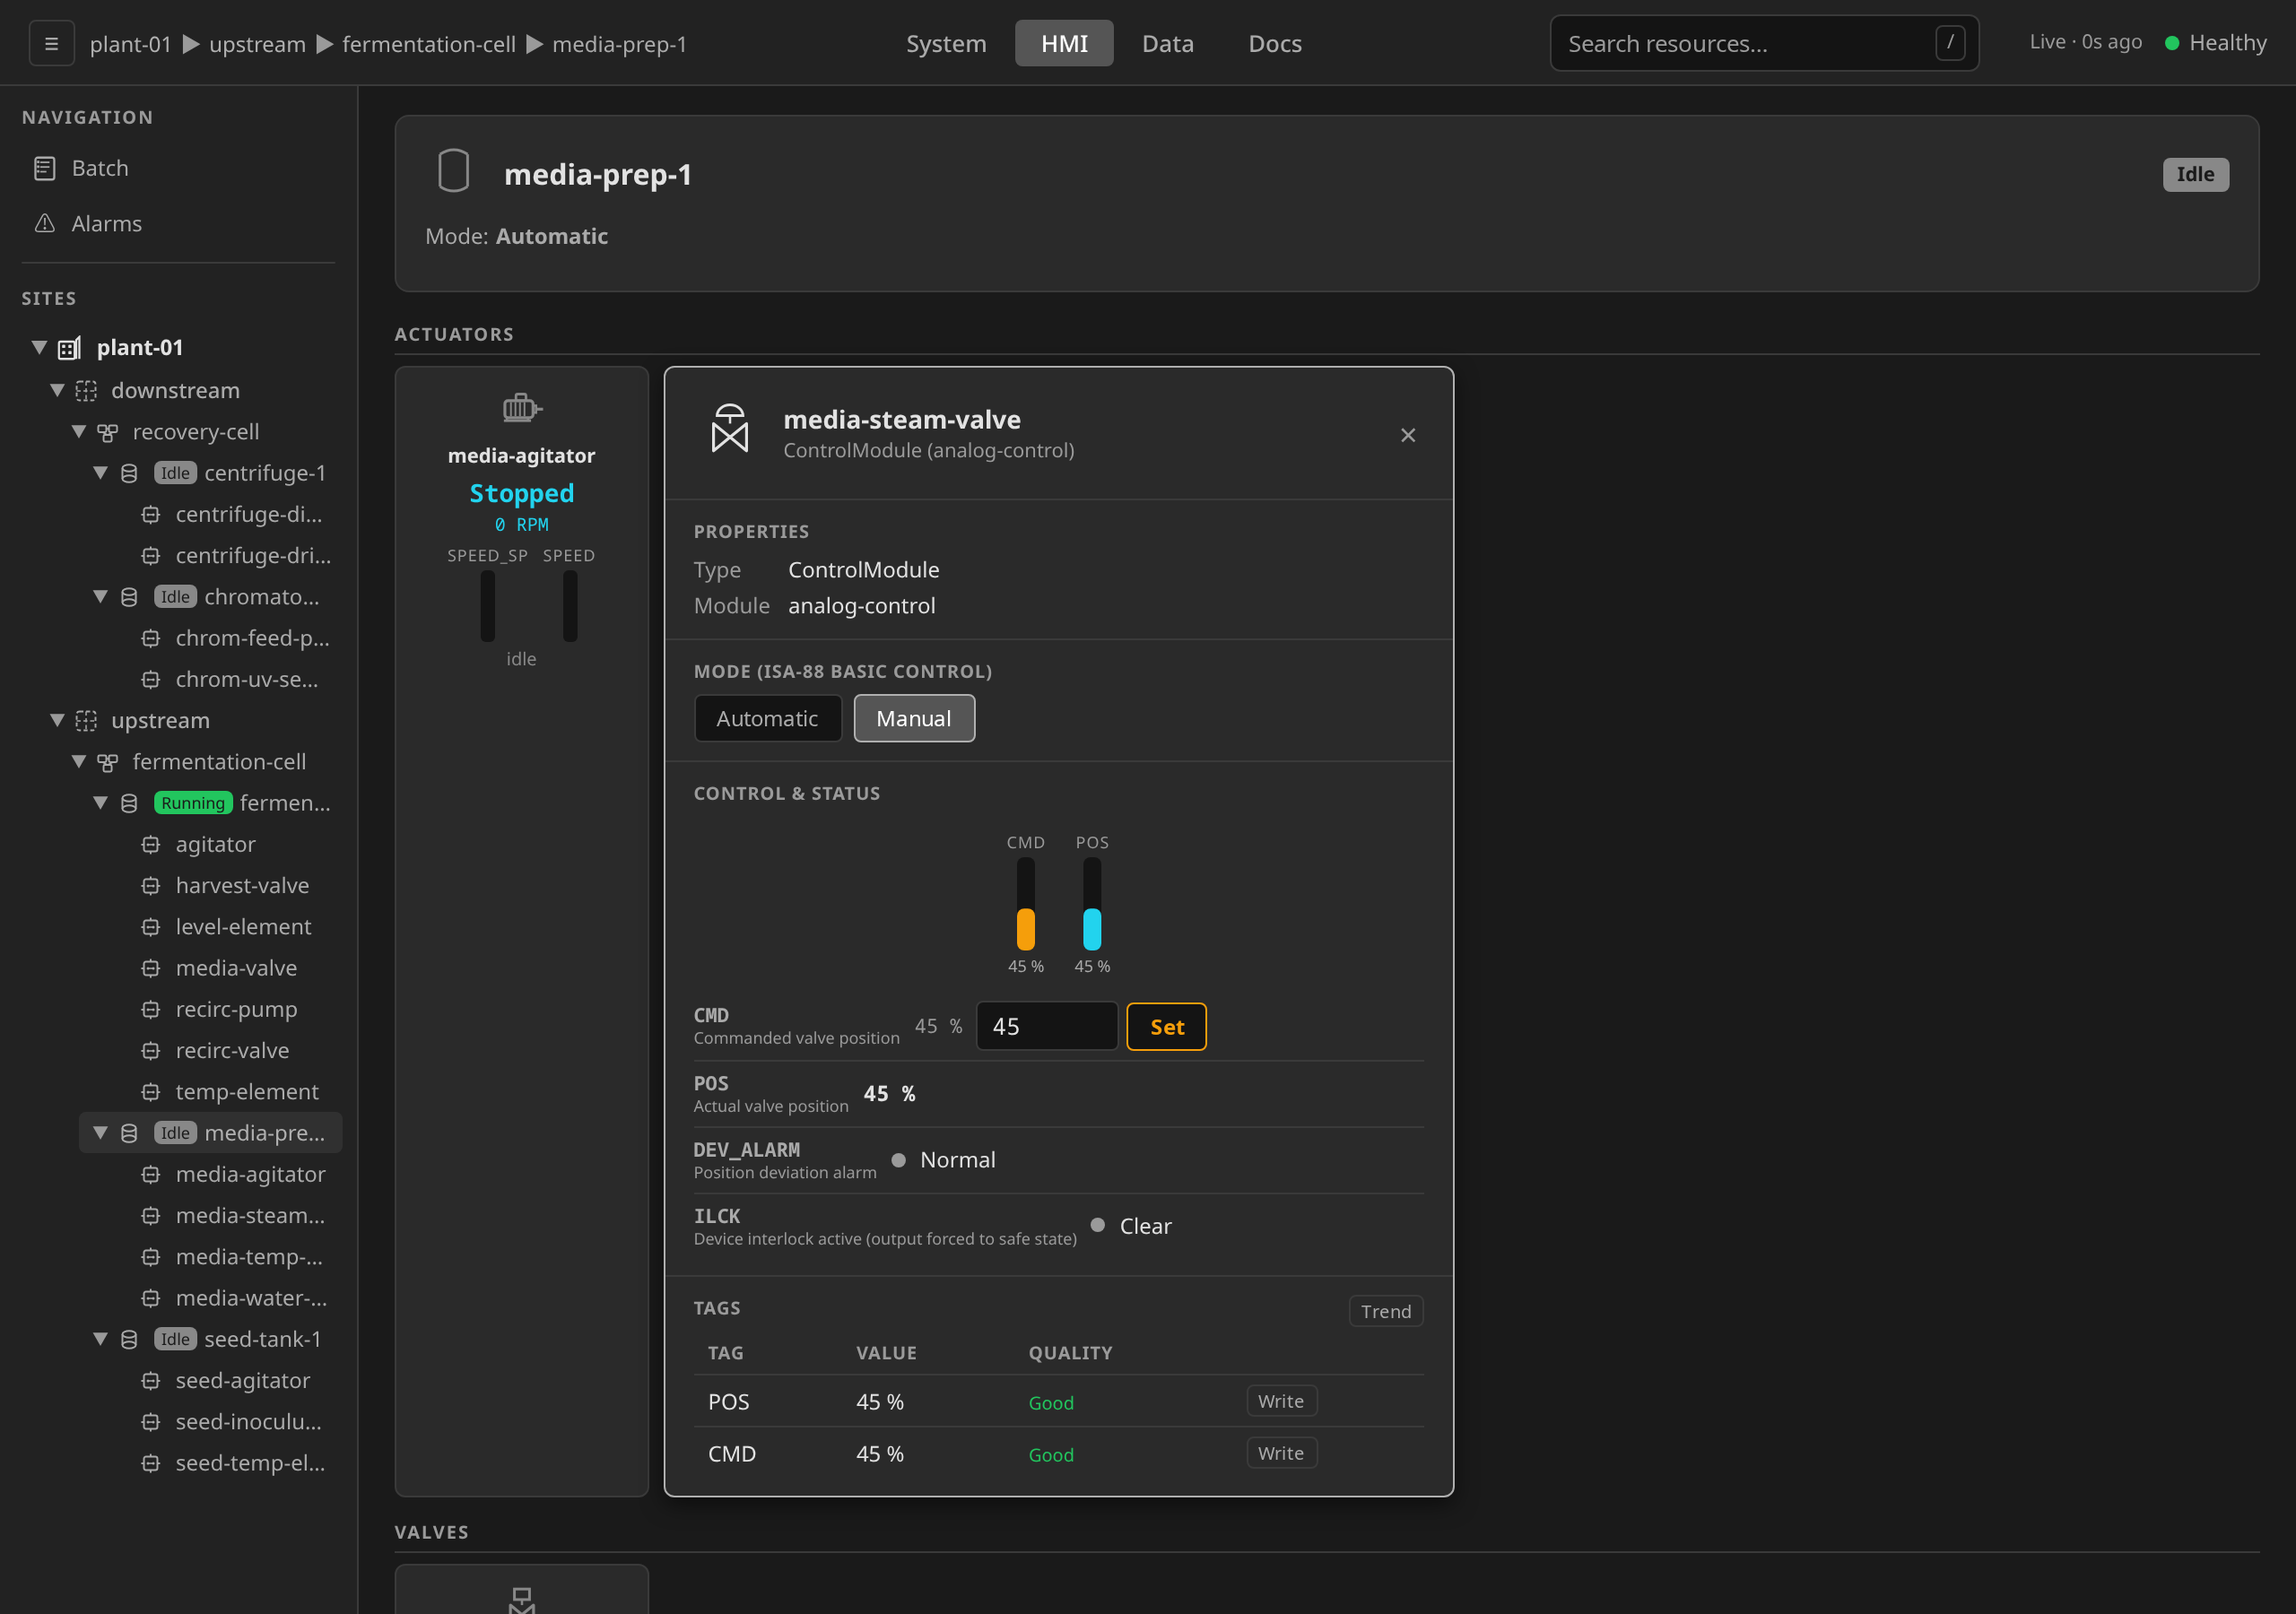
CMD setpoint and POS feedback as paired bar gauges. Deviation alarm.
Shown on the media tank's modulating jacket steam valve, an
analog-control instance.
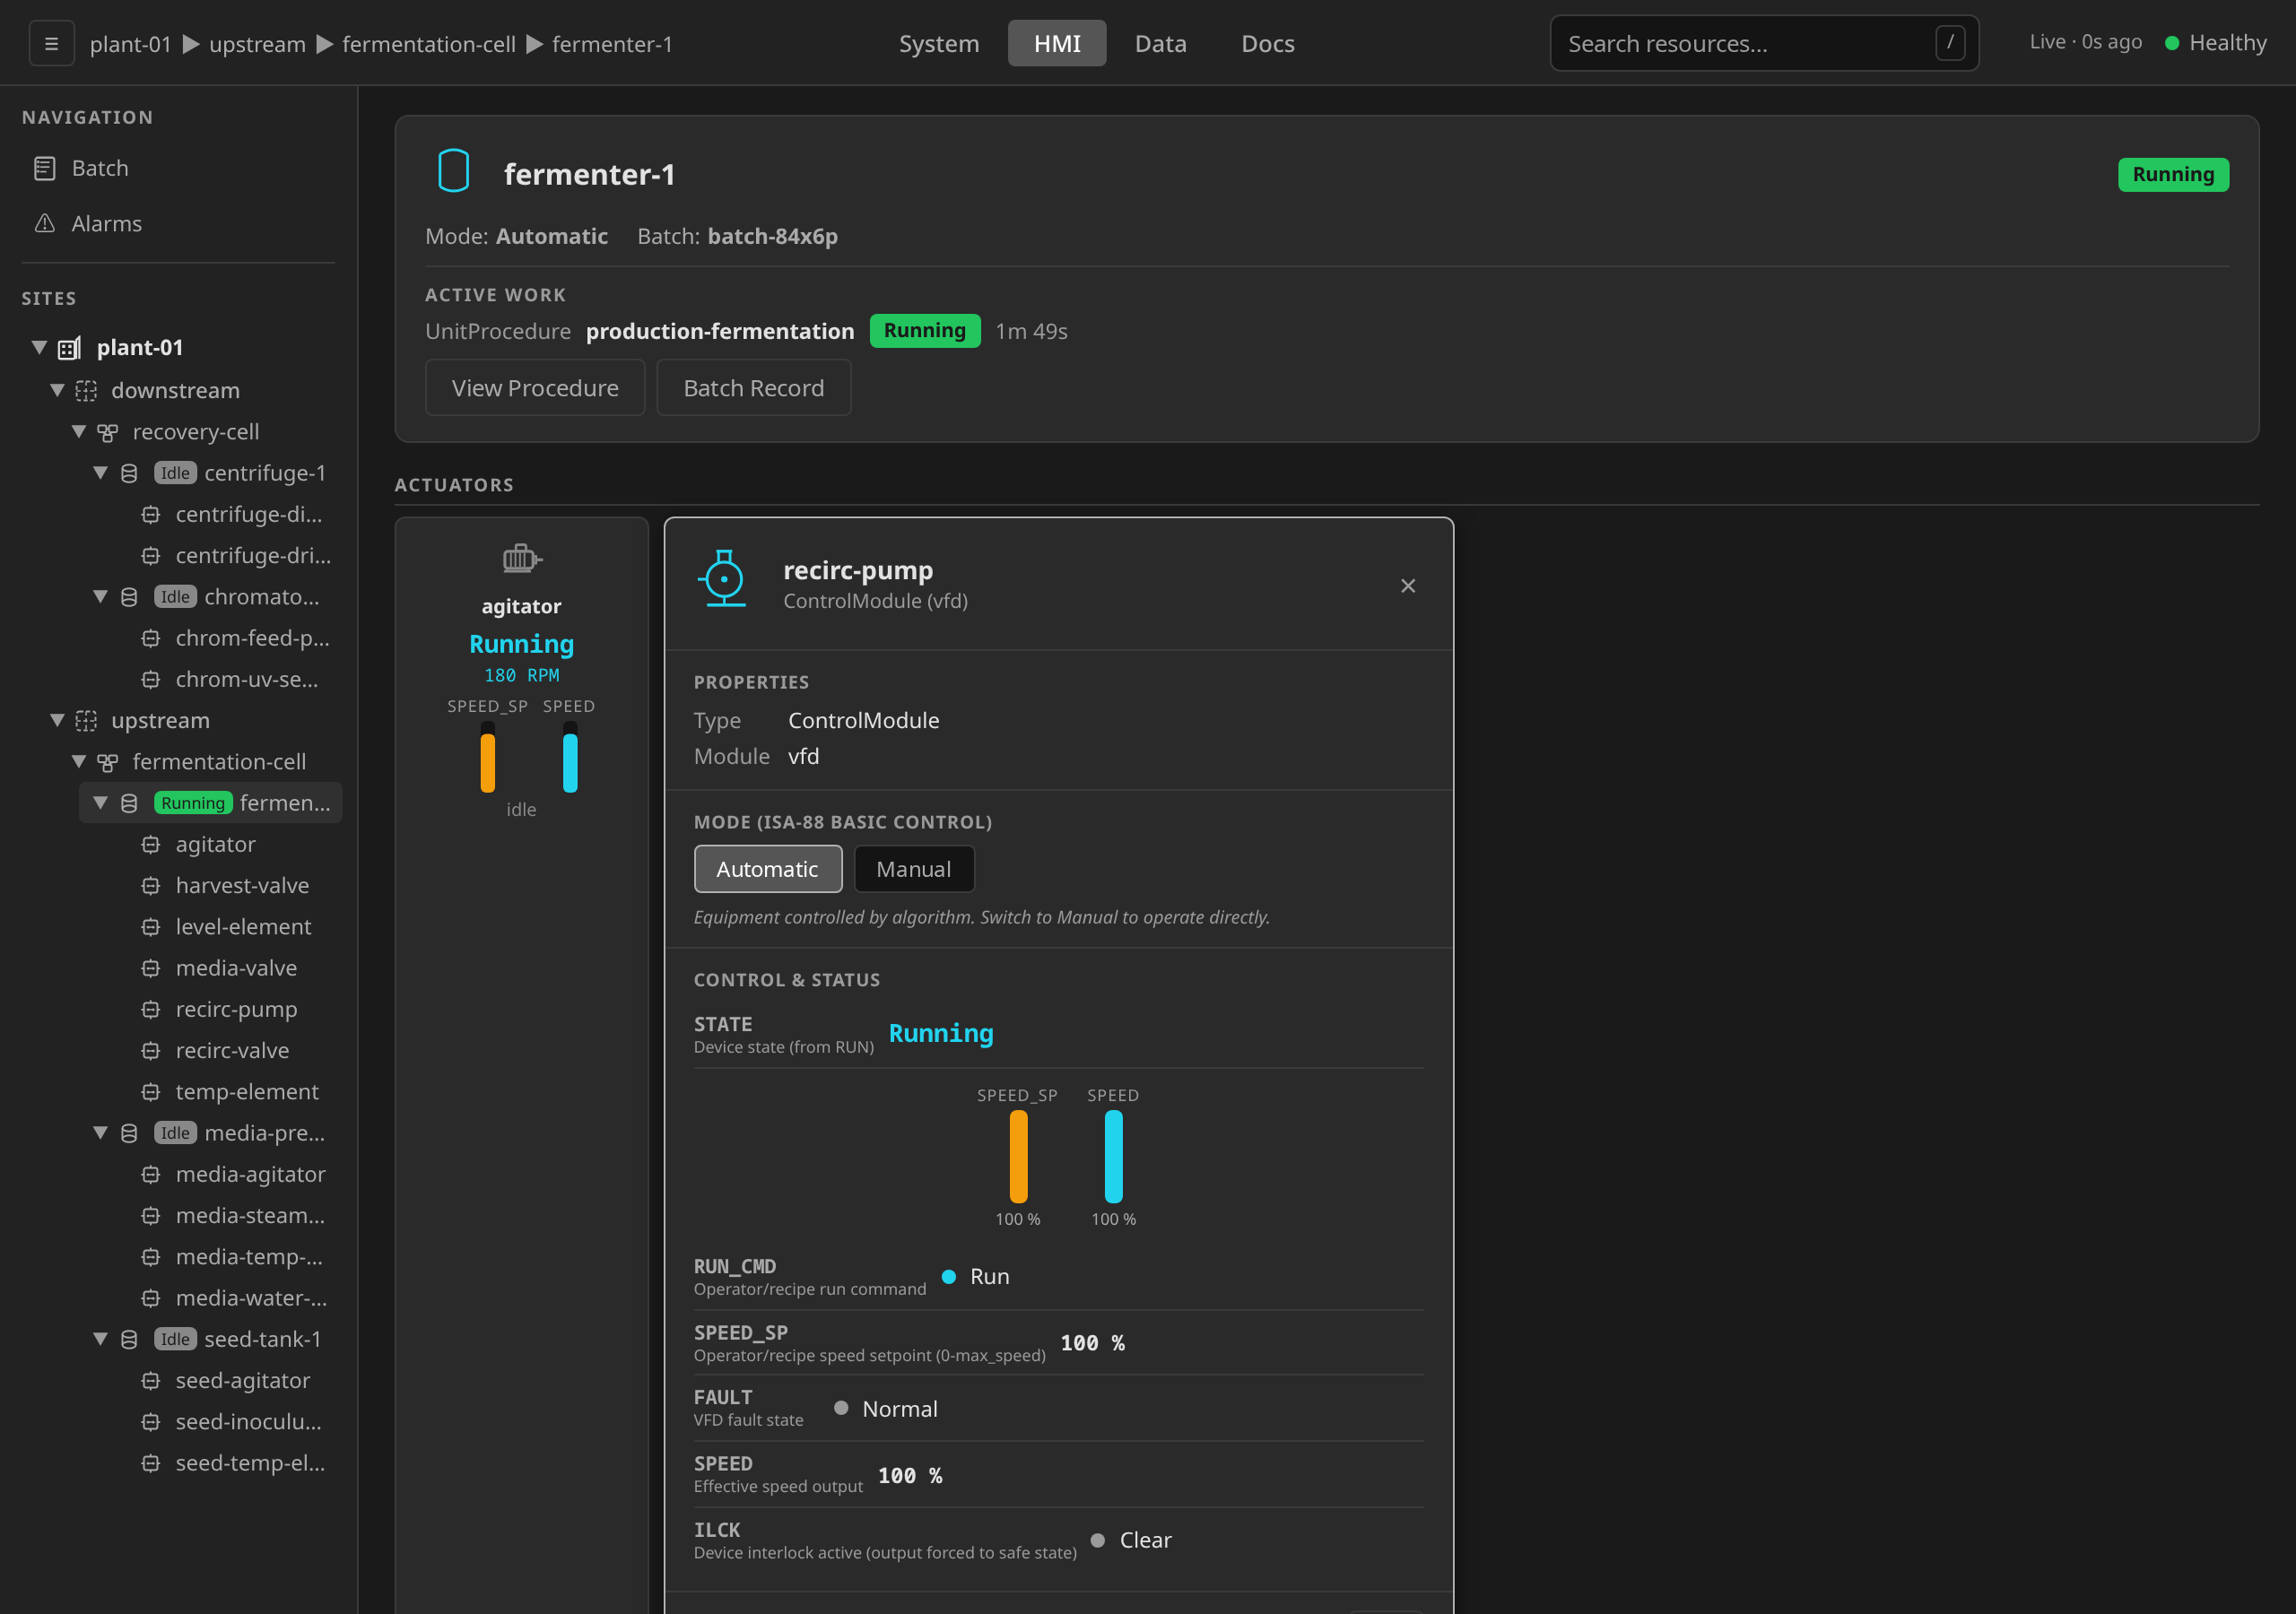
Speed CMD vs feedback. Run command and drive-fault alarm. Shown on the
fermenter's recirculation pump, a vfd instance.
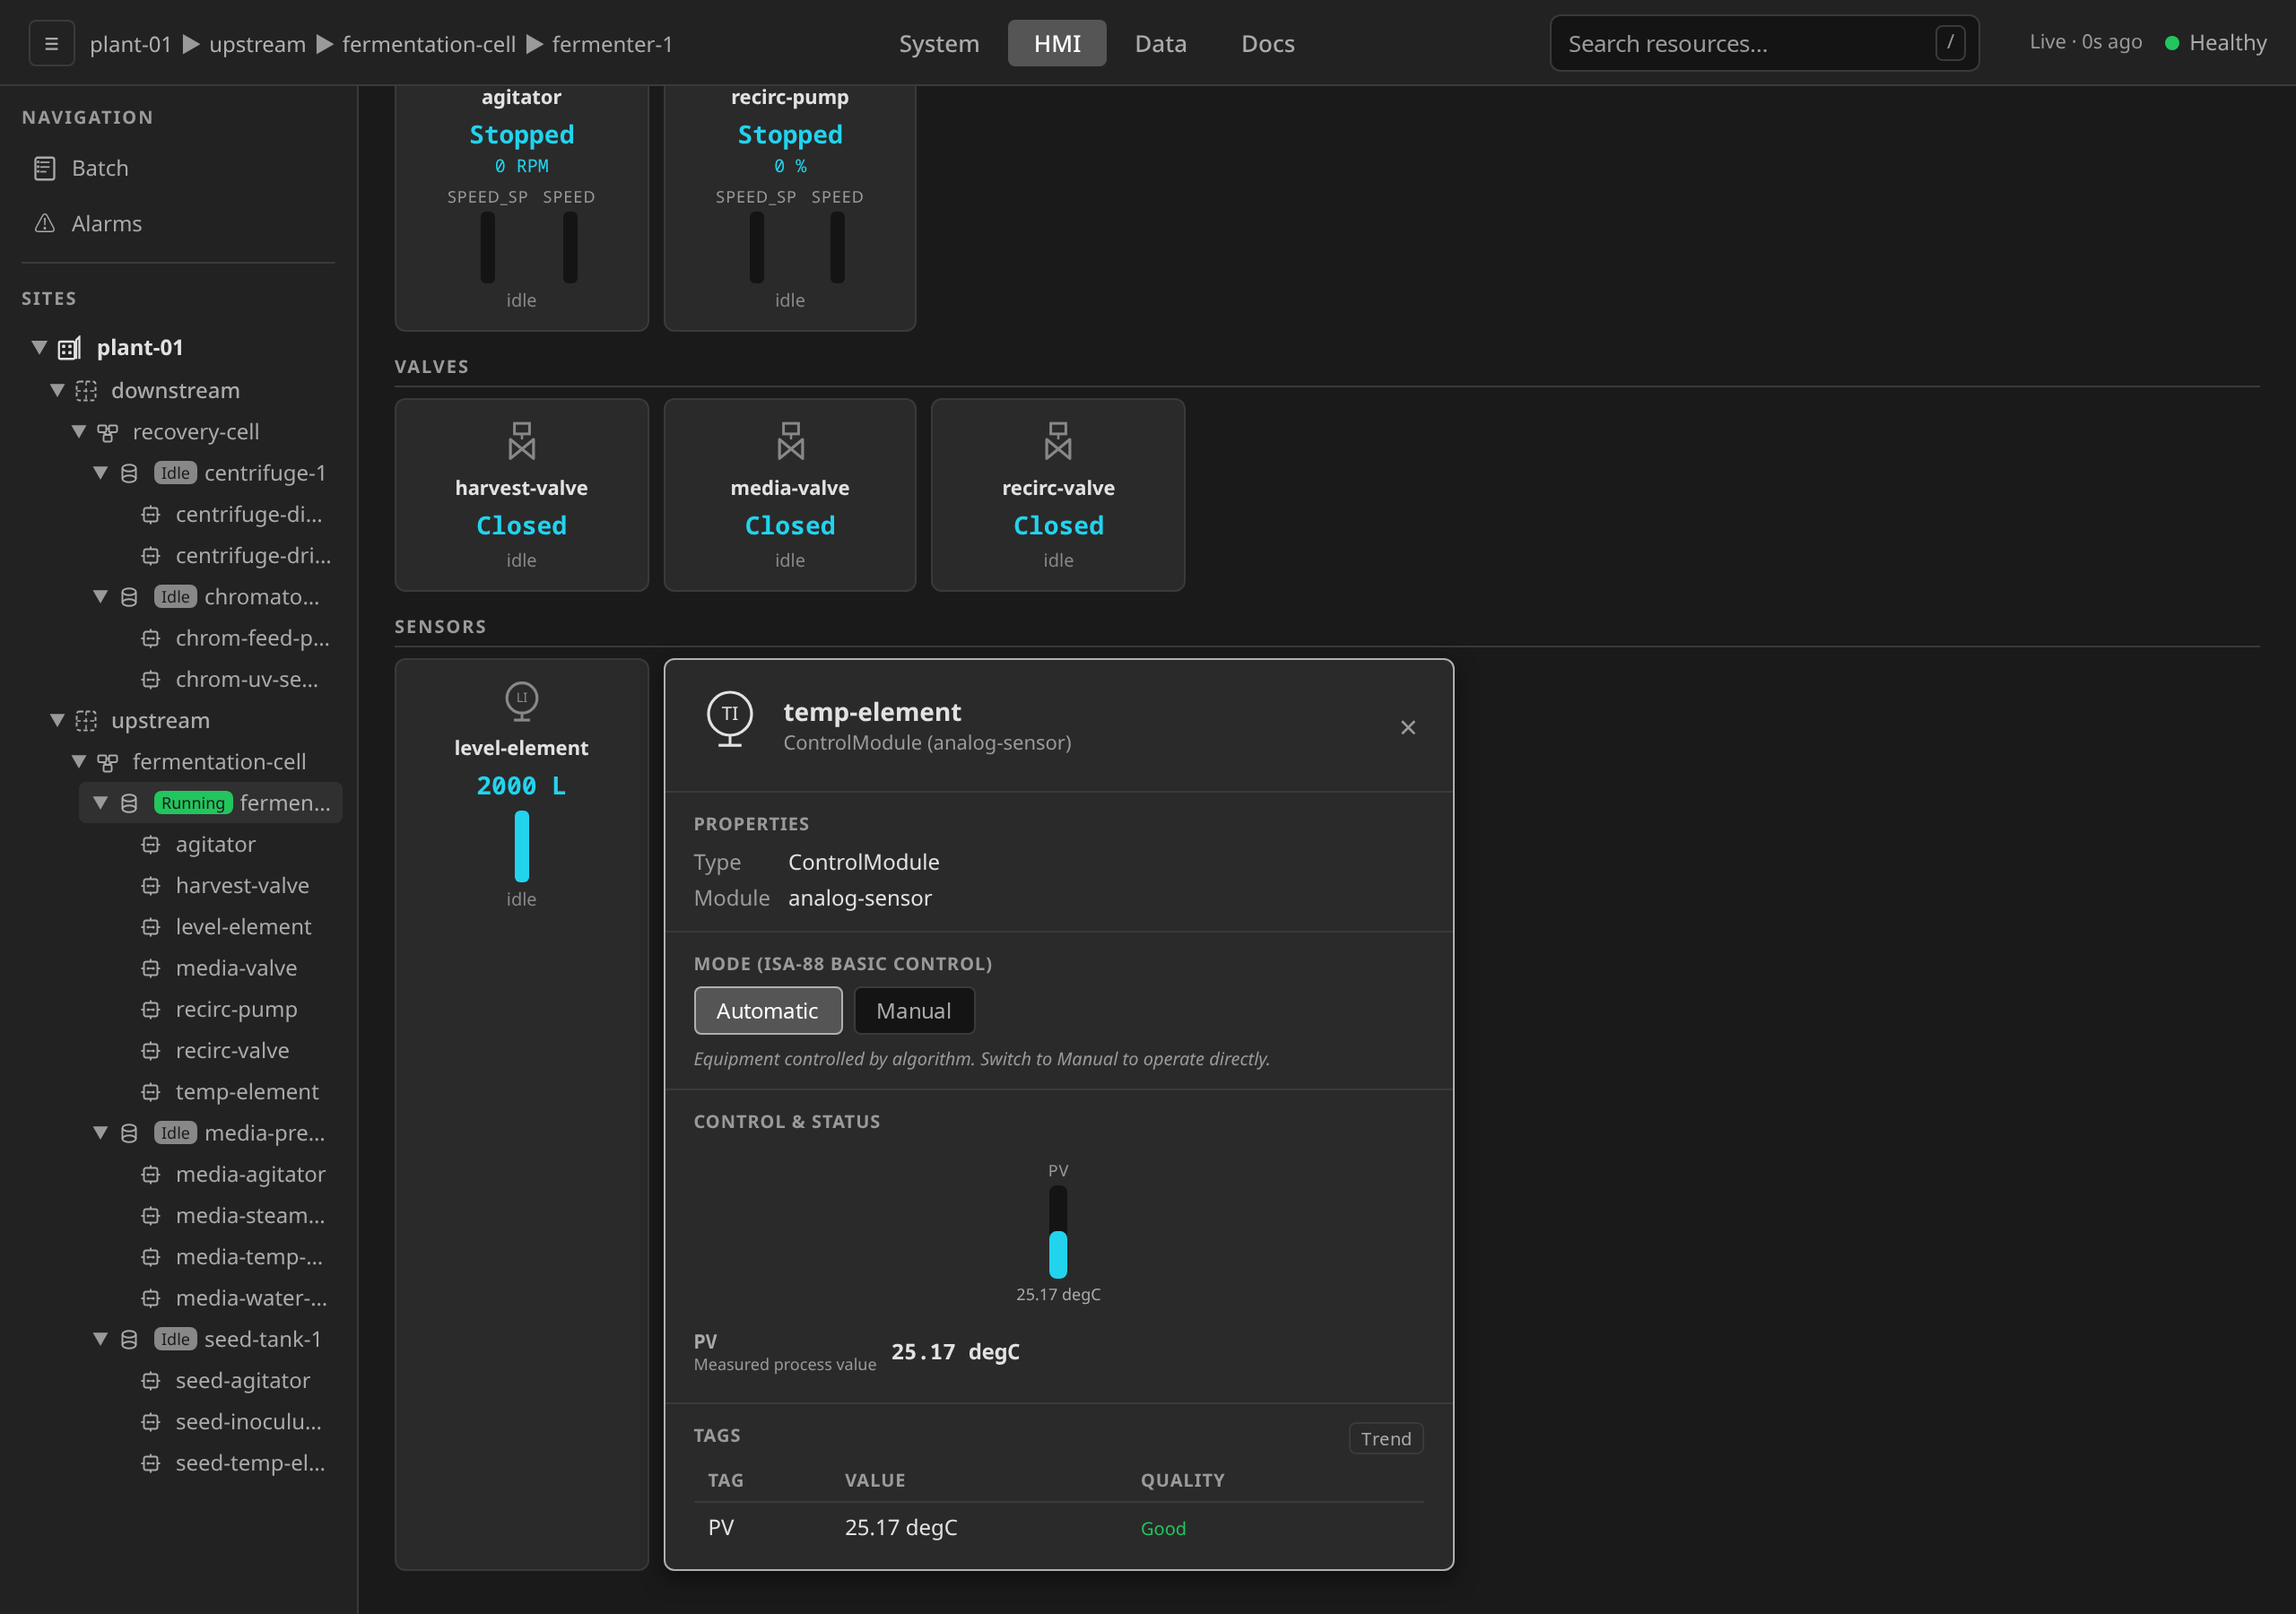
Single PV with engineering-range bar. No writable controls. Shown on the
fermenter's vessel temperature element, an analog-sensor instance.
Whether you can write a value depends on two things: the tag's
accessLevel and the equipment's mode. Only readwrite tags expose a
write widget, and writes are disabled in Automatic mode.
What you can write is bounded by the tag's declared engineering range (ADR 0050). A numeric setpoint input carries the declared minimum and maximum, and its tooltip states them. A value outside the range is refused outright, which is the guard against the device accepting it and quietly clamping. The bar gauges mark a live value that sits outside its range in amber, because a bar can only fill to its own end and would otherwise read as a normal full or empty bar.
Switching to Manual mode
Switching to Manual is the first step before any operator-initiated write. The mode change is written to the equipment's status, audited, and broadcast. Every connected HMI sees the new mode within a second.
/hmi with no batch running: open the media valve in Manual and watch the vessel level climb, then start the agitator and set its speed.
The clip above walks the full manual-control loop on an idle unit: drill into fermenter-1, switch the media valve to Manual and click Open (the level element's reading climbs as media charges in), then take the agitator to Manual, click Run, and set its speed. The steps below break out the mode switch and the writes.
Open the faceplate, locate the Mode (ISA-88 Basic Control) section, and click Manual. The Automatic / Manual pills swap which is highlighted, the "Equipment controlled by algorithm" hint disappears, and the writable-tag controls (Open / Close pills, Set buttons, etc.) light up in the Control & Status panel.
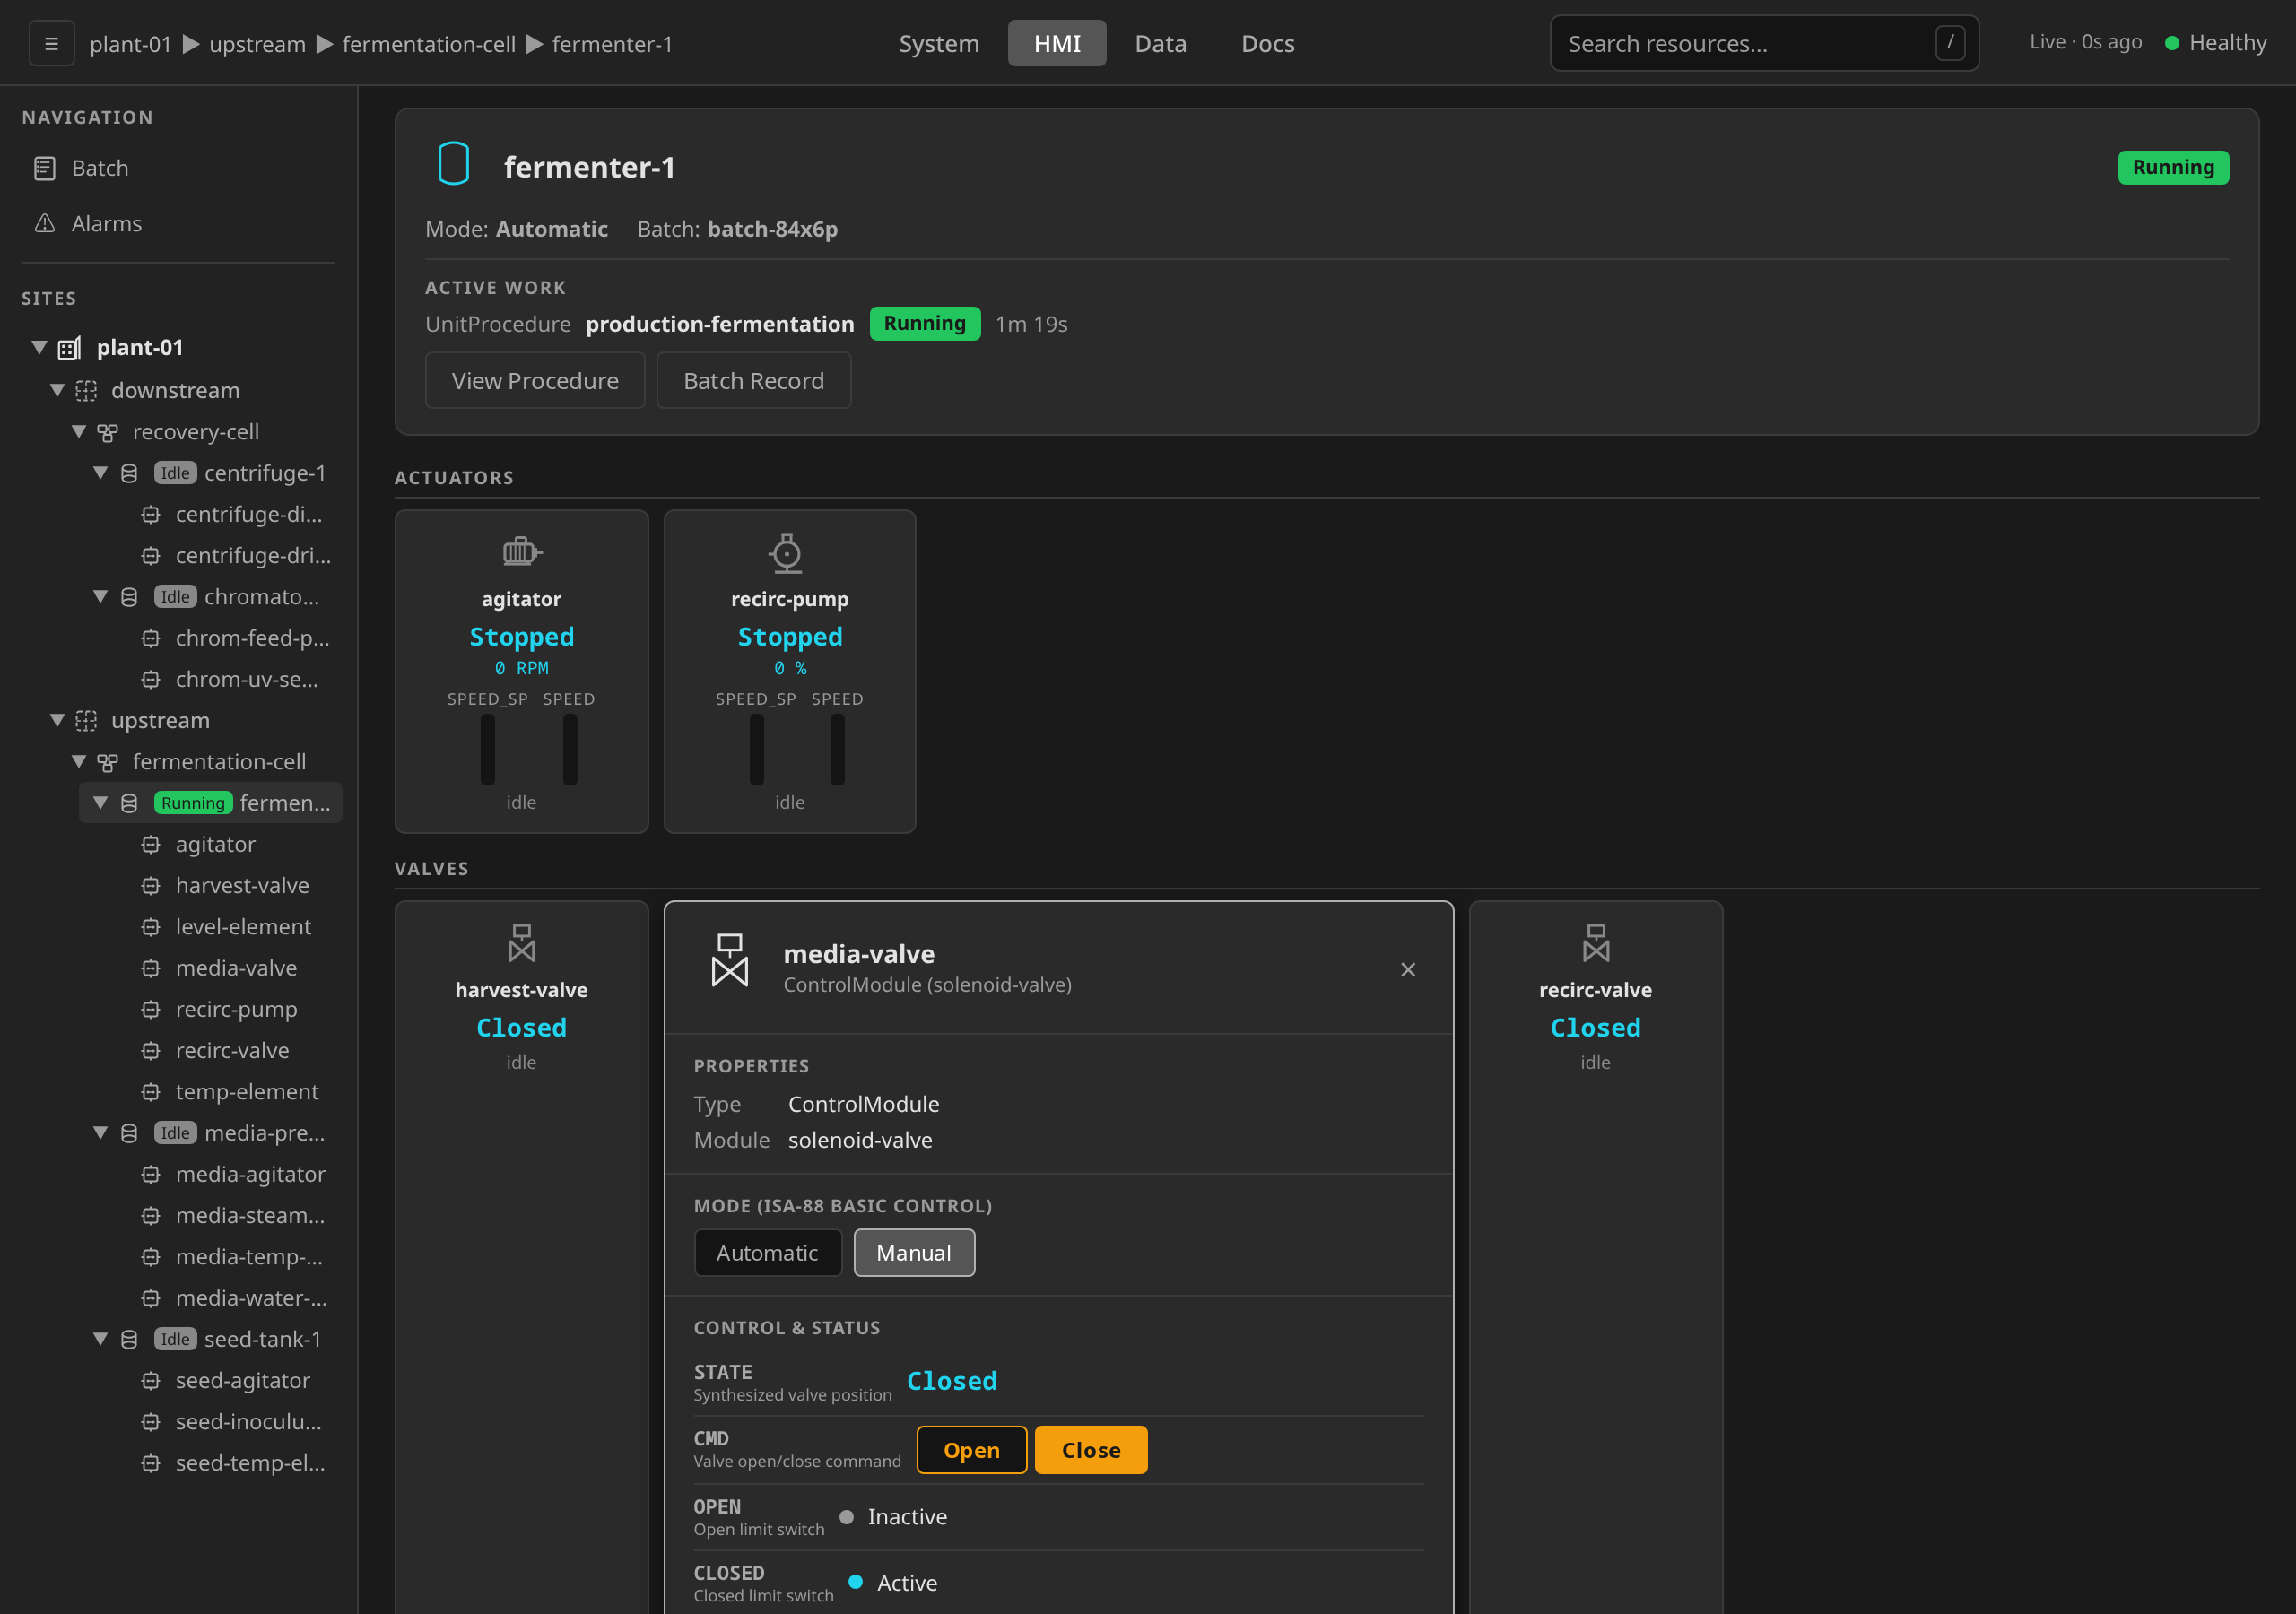
The mode switch writes an audit-trail entry capturing who initiated it and when. Switch back to Automatic when handing control back to the procedure.
dcs mode ControlModule media-valve Manual -s plant-01
Revert with Automatic once you're done. The CLI also accepts
Unit as an equipment kind. In the HMI, the mode toggle appears
only on ControlModule faceplates, and Units have no mode toggle.
Writing a tag value in Manual mode
In Manual mode, every readwrite tag exposes a write control. Discrete
tags render as side-by-side state pills (the active pill is highlighted).
Analog tags render as a numeric input pre-filled with the current value
plus a Set button that commits it directly. (The separate "Write Tag
Value" dialog belongs to the Tags table's Write button alone.)
With the equipment in Manual mode, click the desired CMD pill for discrete tags, or Set for analog tags, on the row in the Control & Status panel. The faceplate shows the value optimistically, and the runtime confirms the write within a tag-poll cycle. Every write creates an audit-trail entry.
Analog (AO-based) ControlModules render the writable CMD row differently. The current value is shown next to a numeric input pre-filled with that value, followed by a Set button that commits the entered number. Engineering range and units come from the template. The input carries that range as its minimum and maximum, and a value outside it is refused in the input itself before anything is sent (ADR 0050).
dcs tag set media-valve.CMD=true -s plant-01
Multiple tags can be set in one call:
dcs tag set media-steam-valve.CMD=75.0 agitator.SPEED_SP=180 -s plant-01
The gateway rejects the write with 403 Forbidden when the equipment
is in Automatic mode or when the tag is read-only. Switch to Manual
first:
dcs mode ControlModule media-steam-valve Manual -s plant-01
A ControlModule is in Automatic unless something put it in Manual, because that is the field's default. The Automatic refusal is recorded in the audit trail alongside permitted writes, so a write that did not happen is as accountable as one that did.
Both refusals are the gateway's own answer on every route that writes
a tag, and on the WebSocket write frame. The same write therefore
refuses the same way however it is spelled. They cover tags a ControlModule
declares, which is what the mode and the access level are declared on.
An address that names no control module, such as an IOModule channel
(ai-1:0), is enforced by the unit runtime instead and its refusal
arrives as a 500.
A phase driving the same tag through its control algorithm is what
Automatic mode means, and it is unaffected. The barrier runs the other
way for a batch: a phase's WRITE is refused when the ControlModule it
addresses is in Manual, because in Manual the output is yours and
not the algorithm's (ISA-88 Table 1). A phase refused this way holds
and the lot survives. Its message names the module and the
MODE(...) call the chart is missing. So a module you take to Manual
while a batch is running stops the batch commanding it, visibly, rather
than leaving you and the phase writing to the same output. See
ADR 0073
for which charts this covers: the safe-state charts a hold, stop or
abort runs are exempt, so bringing equipment to a defined state is never
blocked by a mode switch.
Unit dashboard: Active Work
When a batch allocates this unit and a phase or operation is currently executing on it, the unit header grows an Active Work block directly under the Mode / Batch line. The block is the unit-level "what is this equipment doing right now?" answer. There is no unit faceplate, because ISA-88 commands flow through the running batch. The unit itself takes none directly.
The block shows four read-only fields plus two navigation buttons:
| Field | Example | Meaning |
|---|---|---|
| Kind | Phase |
The procedural element type currently running on the unit (Phase, Operation, UnitProcedure). |
| Name | fermenter-1-charge-media |
The exact resource name — clickable target for the buttons below. |
| ISA-88 state pill | Running |
Live state of that element (Running, Held, Pausing, etc.), color-matched to the same pill on the batch view. |
| Elapsed | 00:04:12 |
Wall-clock time since the element entered its current state. |

The two buttons are observation shortcuts (read-only navigation). Each goes to the product's own view of what it names:
- View Procedure opens the batch's detail in the HMI, whose Procedural SFC section drills the running procedure with the current step highlighted (see Drilling into the procedural tree). The breadcrumb and the sidebar tree walk back to the unit.
- Batch Record opens the printable batch production record at
/record, in a new tab, with parameters, events and the audit trail. The process display stays where it was in the tab behind it.
When no batch is allocated to the unit, this block is hidden entirely. The header collapses back to just the equipment name, mode, and Idle state pill (as in the screenshot at the top of this section).
The block appears and disappears on its own. A dashboard that was already open when the batch was started picks the allocation up within a few seconds, so an operator watching the unit never has to reload the page.
CM health banner
ControlModule faceplates show a small health banner in the header when the underlying FB network has a problem. The faceplate header carries no run-state pill of its own. A control module's run-state (Stopped/Open/…) is a field reading shown in the Control & Status rows below. The banner is therefore the header's only status indicator, and it appears only when there's a problem to flag. The banner has three mutually exclusive states:
| Banner | Meaning |
|---|---|
| (hidden) | FB network is Running — Control & Status reads come through the CM logic as designed. |
| Network Down | The unit-runtime pod isn't reachable. Reads fall back to the I/O driver directly; values still display but are decorated with a RAW quality chip to flag that they bypass the CM's regulatory logic. |
| Compile Error | The CM template's ST or FBD failed to compile. The CM is offline; writes are rejected. |
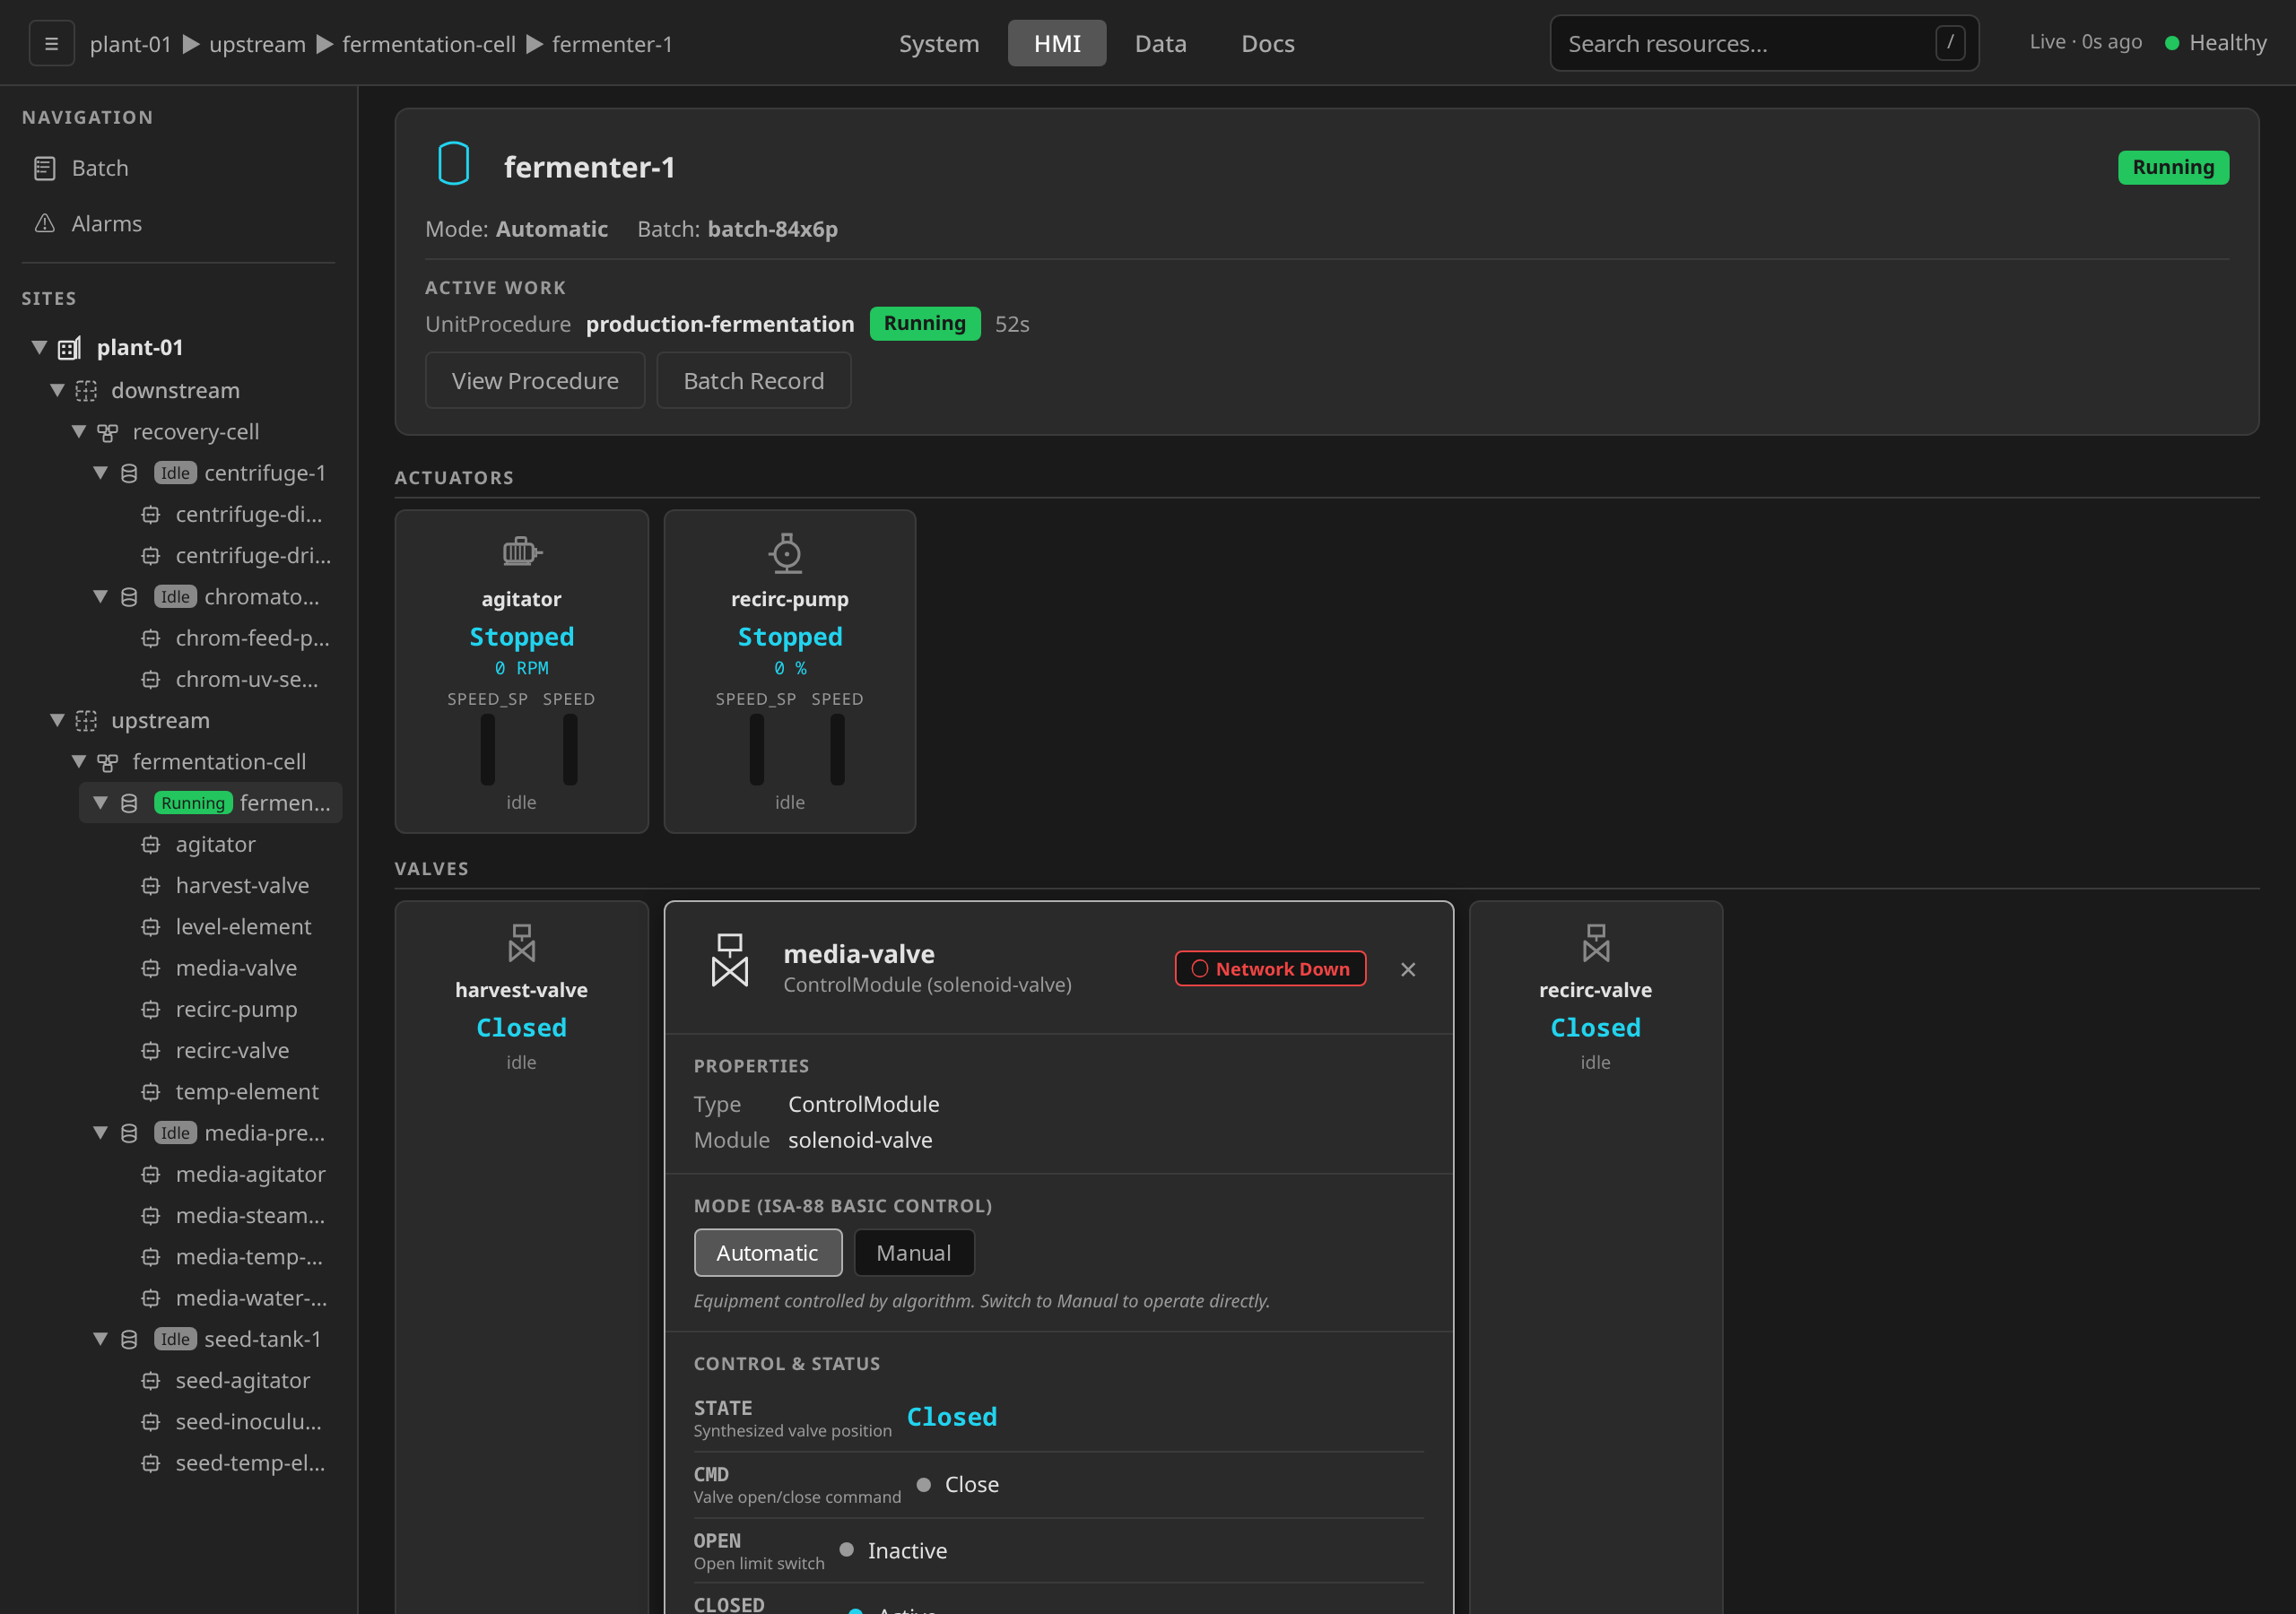
When the banner is anything other than hidden, treat the faceplate's control values with skepticism and route to the Diagnostics view to find the failing runtime pod or compile error.
Device health (NE 107)
A control module whose CR declares spec.deviceHealth carries a
DEVICE HEALTH row in Control & Status: the instrument's NAMUR NE 107
self-diagnosis, polled from the device's own DeviceHealth variable and
rendered exactly as served
(ADR-0043).
The discovery wizard writes the field for a recognized PA-DIM instrument
(see PA-DIM ingestion).
This is the device's verdict about its own fitness, distinct from the
process value it measures. A transmitter can report a perfectly
plausible flow while asking for maintenance.
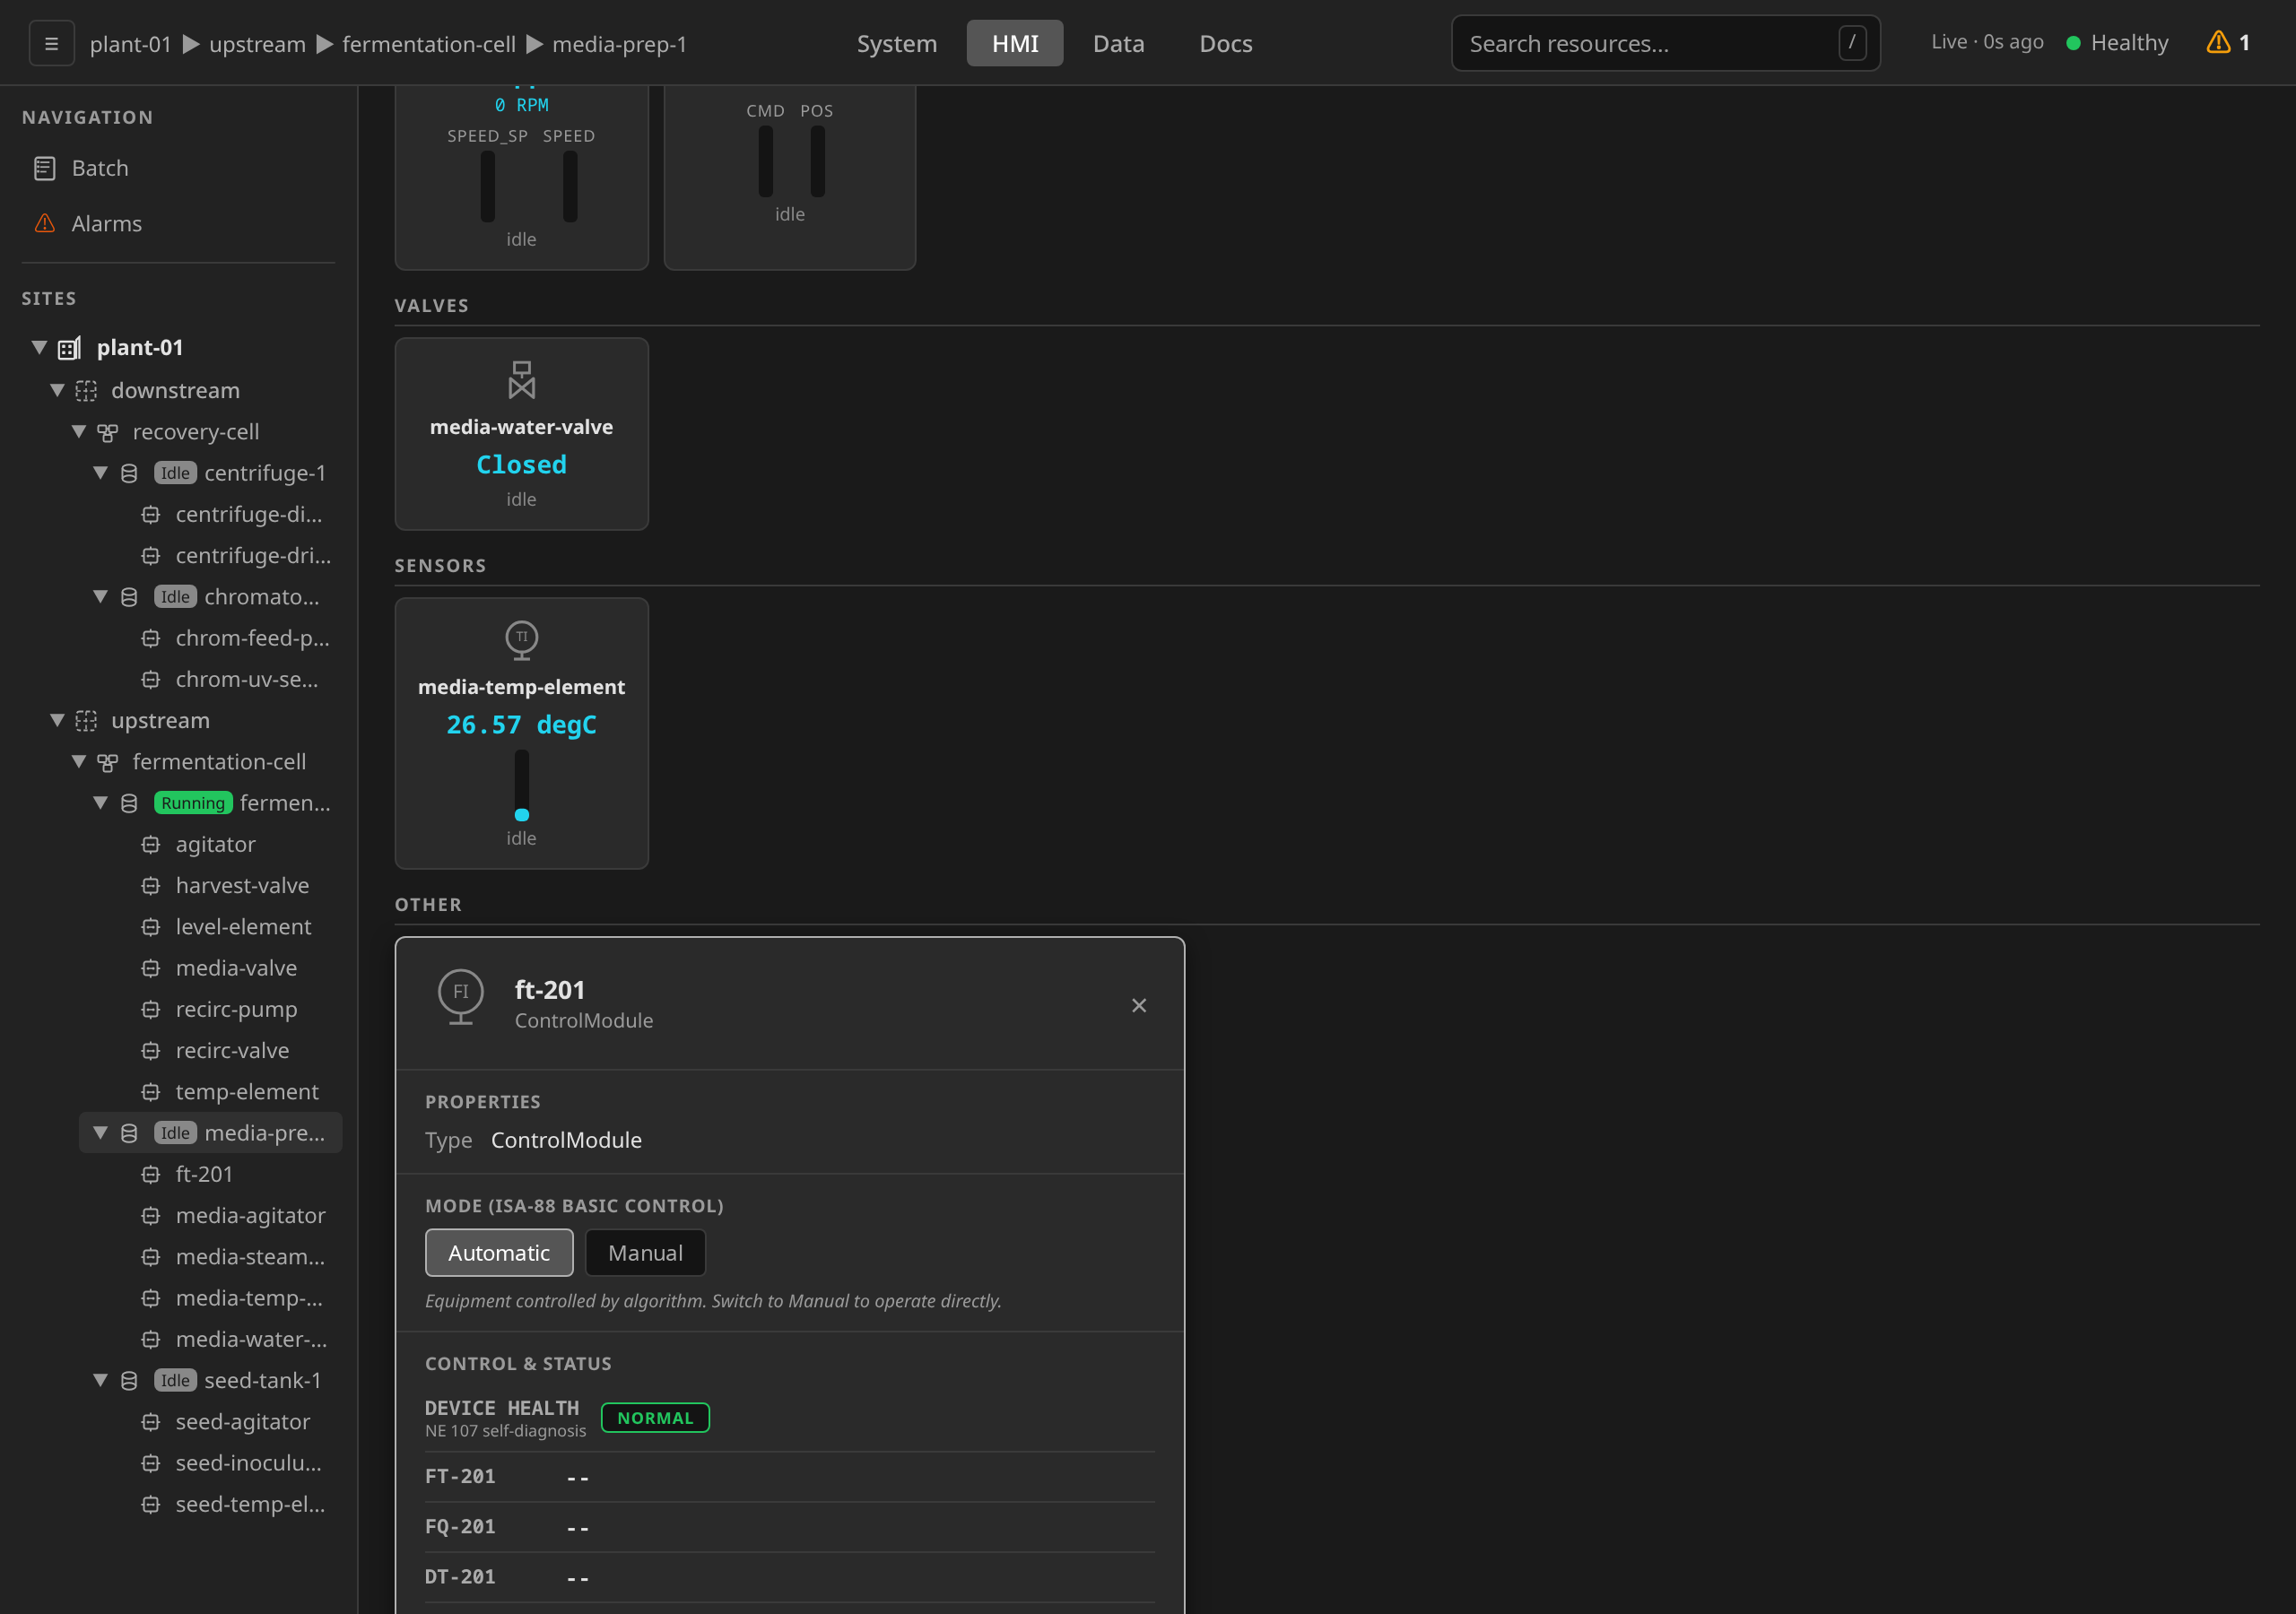
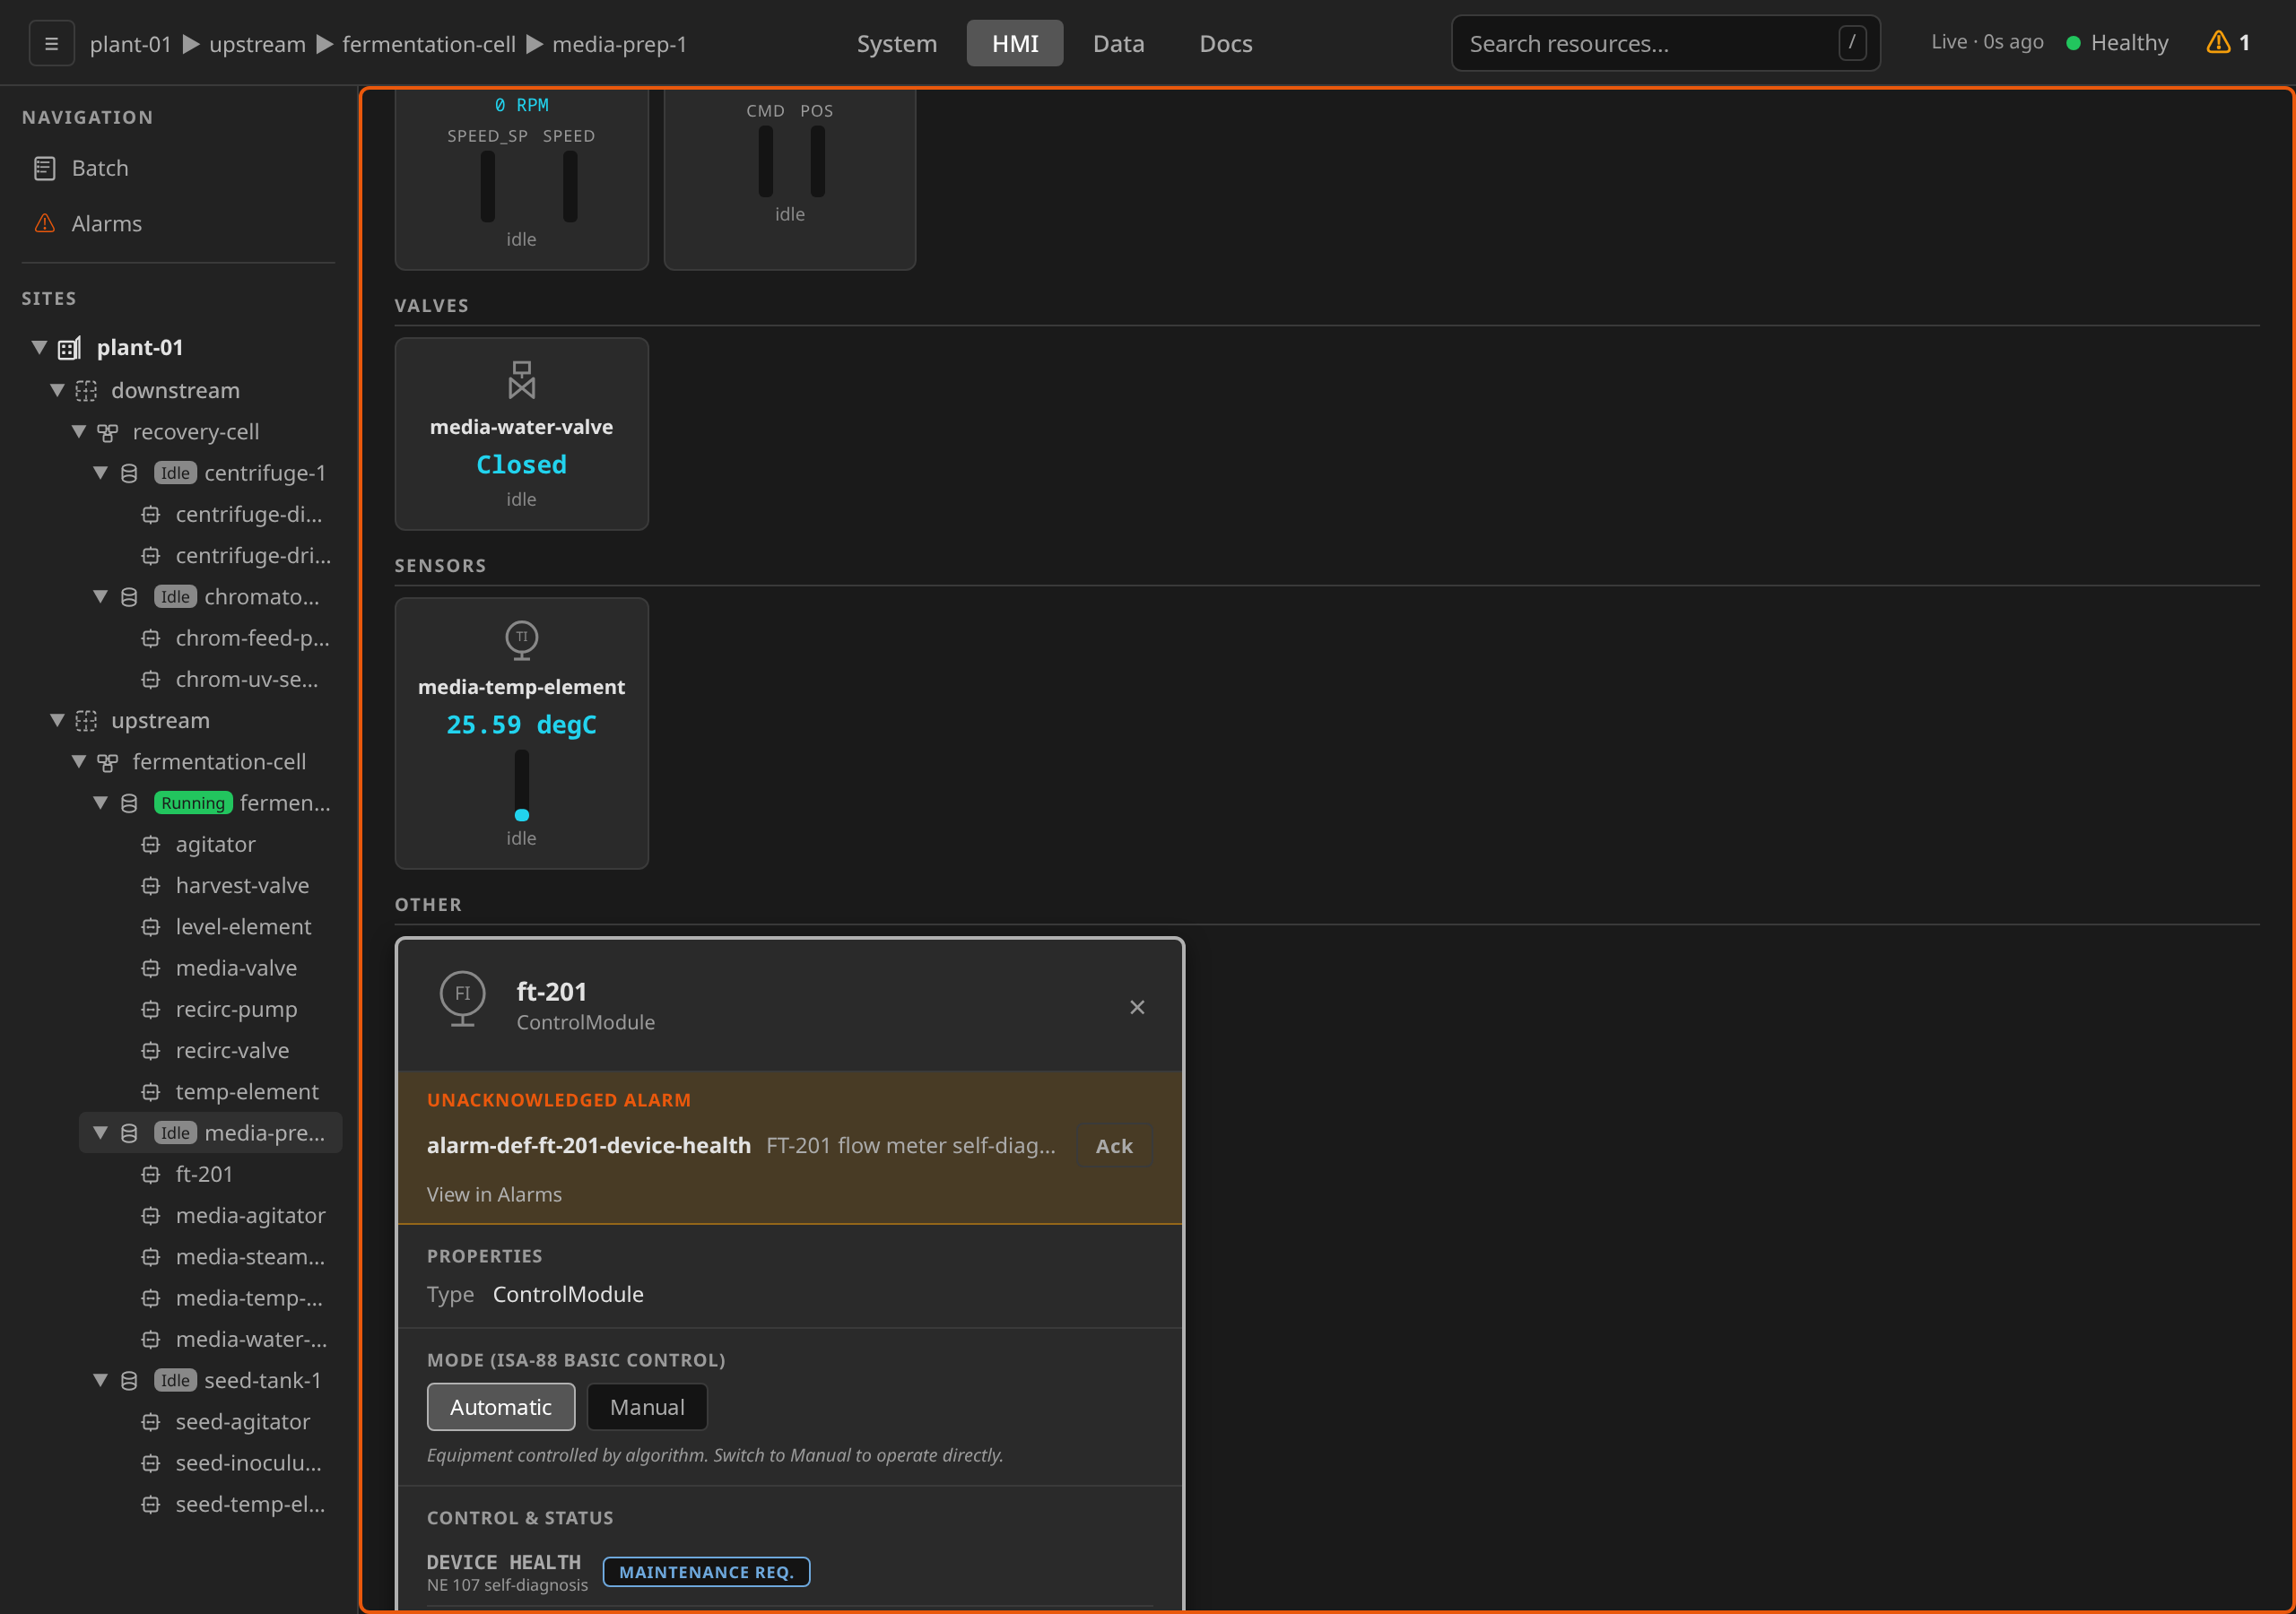
The pill uses NE 107's own color vocabulary: NORMAL green, FAILURE red, CHECK FUNCTION orange, OFF SPEC yellow, MAINTENANCE REQ. blue (see the UI color guide). Operators who know these colors from vendor device managers can read the row without translation.
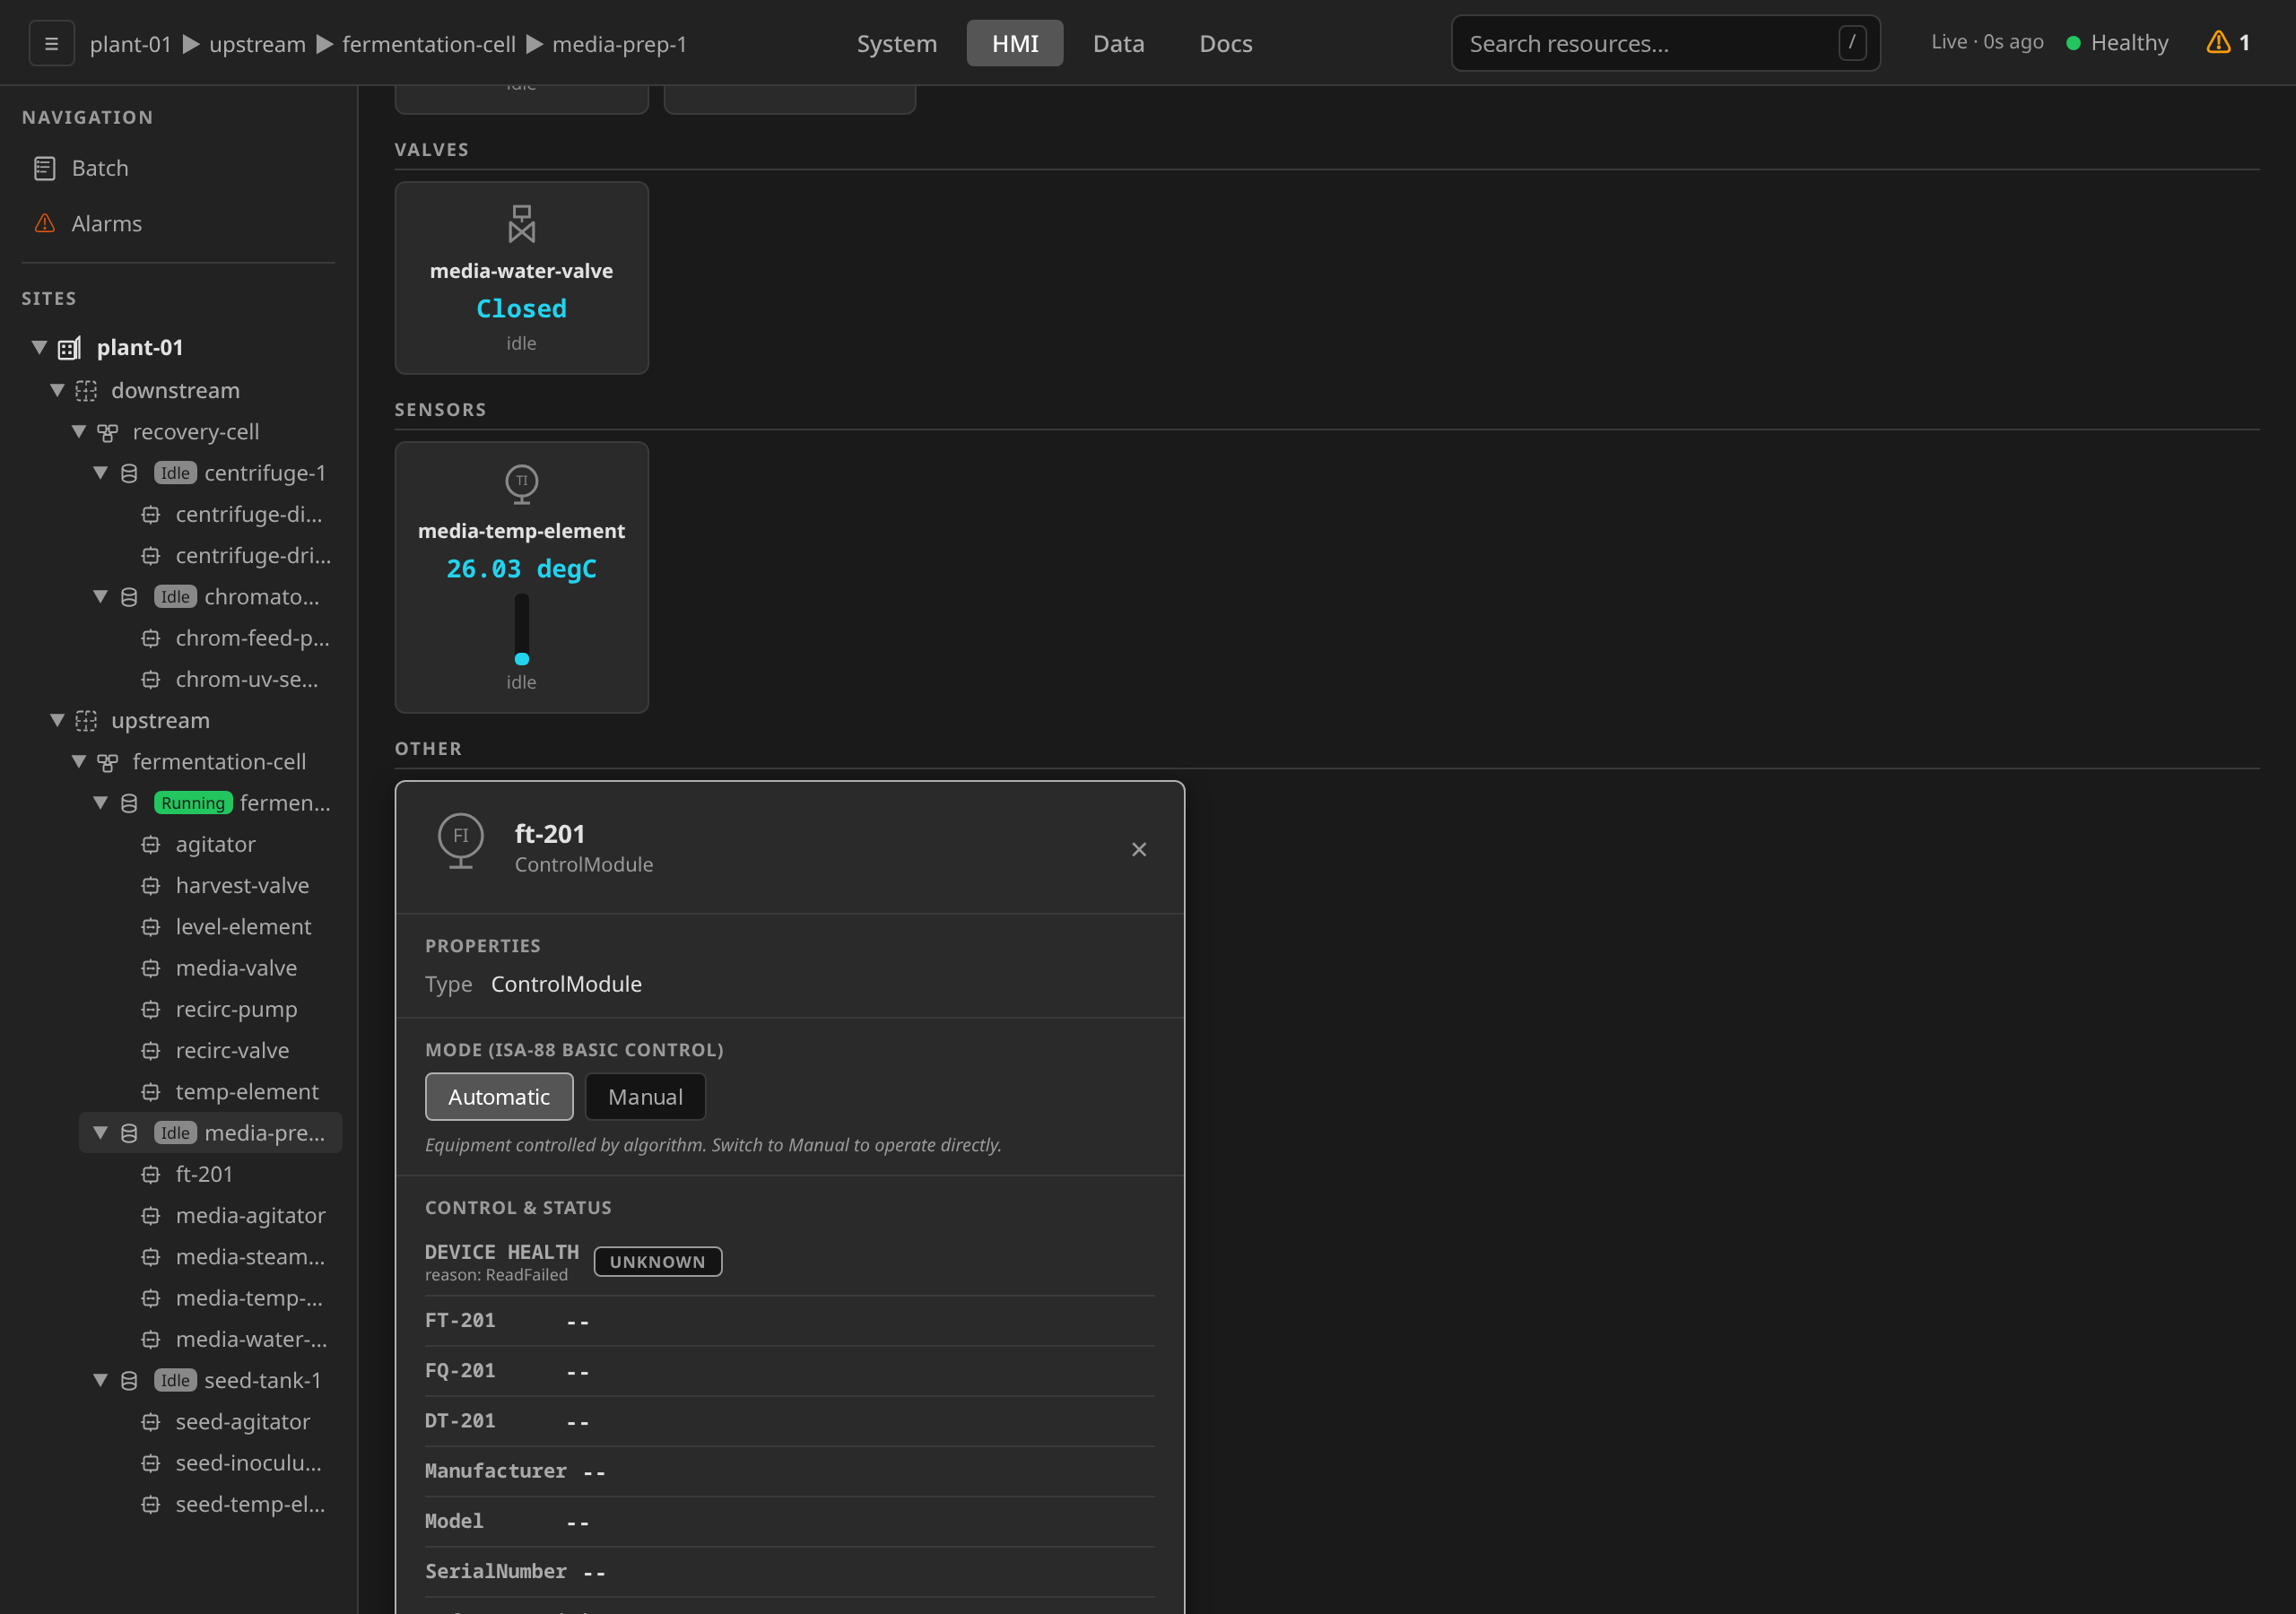
Absence is not a state. When the poll cannot read the device, the row
shows UNKNOWN with the served reason (ReadFailed, NotReported,
or UnrecognizedValue). A blind channel never renders as a silently
healthy instrument, and a module that declared no deviceHealth block
shows no row at all.
A deployment that wants a health state annunciated declares a
DeviceHealth alarm on the module (see
Annunciate instrument health).
Alarm Awareness
Equipment views surface active alarms as visual indicators. Triage and shelving happen in the dedicated Alarms view. Acknowledgment can happen either there or inline on the alarming control module's faceplate. There are four indicators on the equipment surfaces:
- Cross-endpoint alarm badge in the top bar shows the site-wide active
count on every page. Clicking it jumps to the HMI Alarms view. The count
refreshes on a 15-second poll of
/api/v1/sites/{site}/alarms. - Alarmed unit cards — on the ProcessCell view, a unit card with one or more unacknowledged active alarms (its own or one of its child control modules) gets a static amber border. The border clears the moment the alarm is acknowledged, even if the underlying condition is still active.
- Equipment card + faceplate borders — on the unit dashboard, the card of each module with an unacknowledged alarm carries a static amber border, and so does any faceplate open for one. The border sits on the alarming module alone and traces the alarm to its source. An alarm sourced by the unit itself has no module card, so it borders the unit header instead.
- Amber nav icon — the Alarms entry in the HMI sidebar turns solid amber whenever any unacknowledged active alarm exists in the current site.
Each open faceplate carries an inline alarm strip at the top listing every unacknowledged alarm on that control module, with a per-row Ack button and a View in Alarms link to the global view. Acknowledging from the strip uses the same API and audit trail as acknowledging from the Alarms view. To shelve, still use the Alarms view. See Alarm Management for the full ISA-18.2 alarm lifecycle, severity levels, and acknowledgment rules.
Keyboard and Refresh
The HMI uses the same REST API and WebSocket infrastructure as external SCADA integrations. See SCADA Integration. After deploying UI changes, hard-refresh (Ctrl+Shift+R) to bypass browser cache.